|
|
|
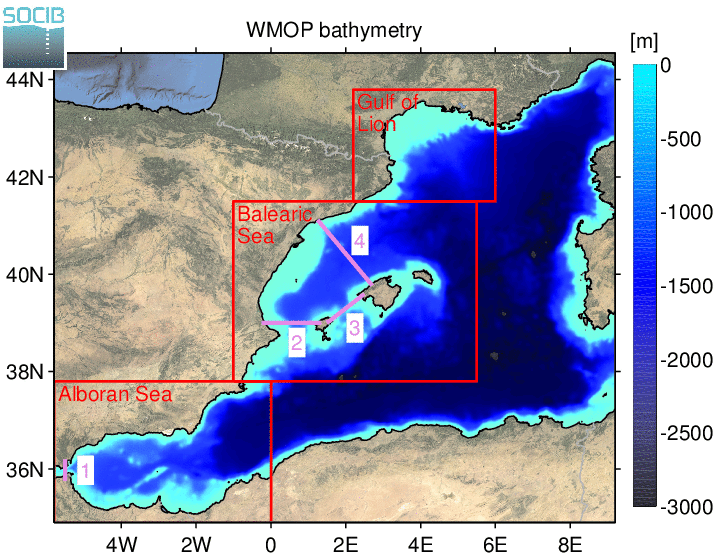
Figure 1: Western Mediterranean bathymetry and sub-regions (red lines) used for the computation of indicators. The four key sections considered to compute volume transports are represented by the pink lines. |
Volume Transports
In this section, the latest 30-day time series of volume transports through four key sections (see Figure 1) are displayed.
The four sections are the following:
- Gibraltar strait
- Ibiza Channel
- Mallorca Channel
- Soller-Tarragona section
|
|
|
| Figure 1: Transport through the Strait of Gibraltar | Figure 2: Transport through the Ibiza Channel |
|
|
|
| Figure 3: Transport through the Mallorca Channel | Figure 4: Transport through the Soller-Tarragona section |
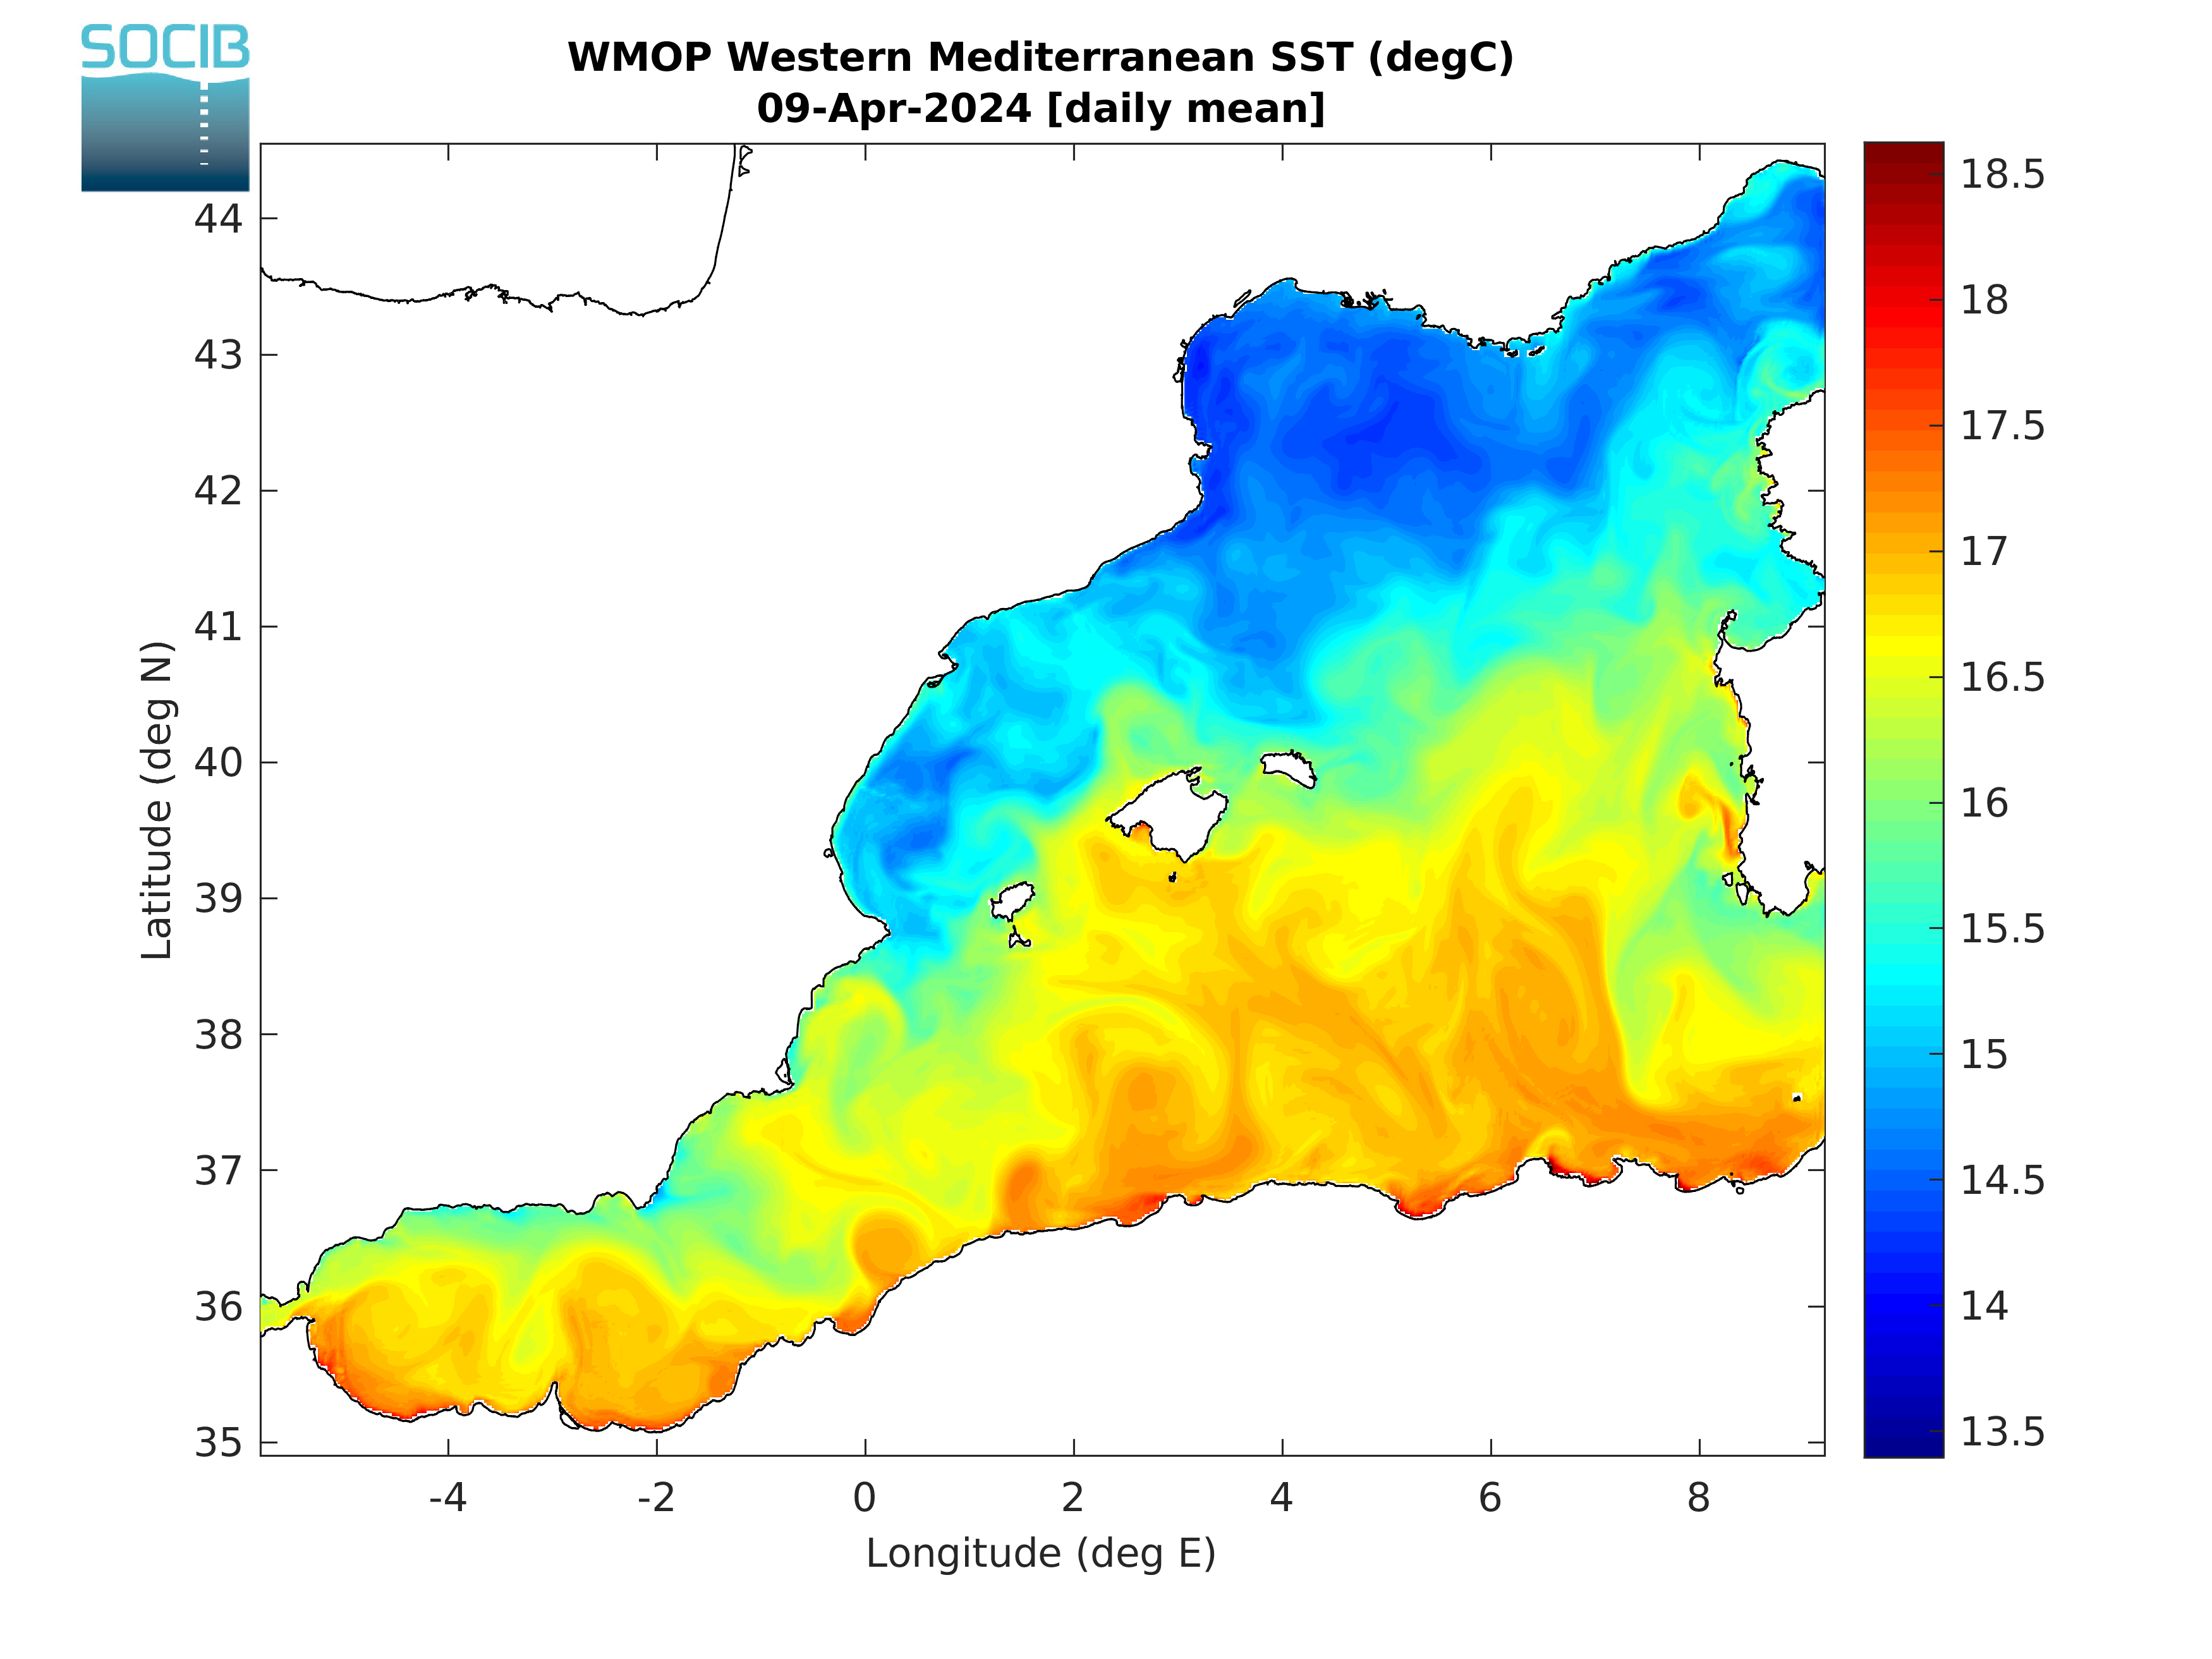
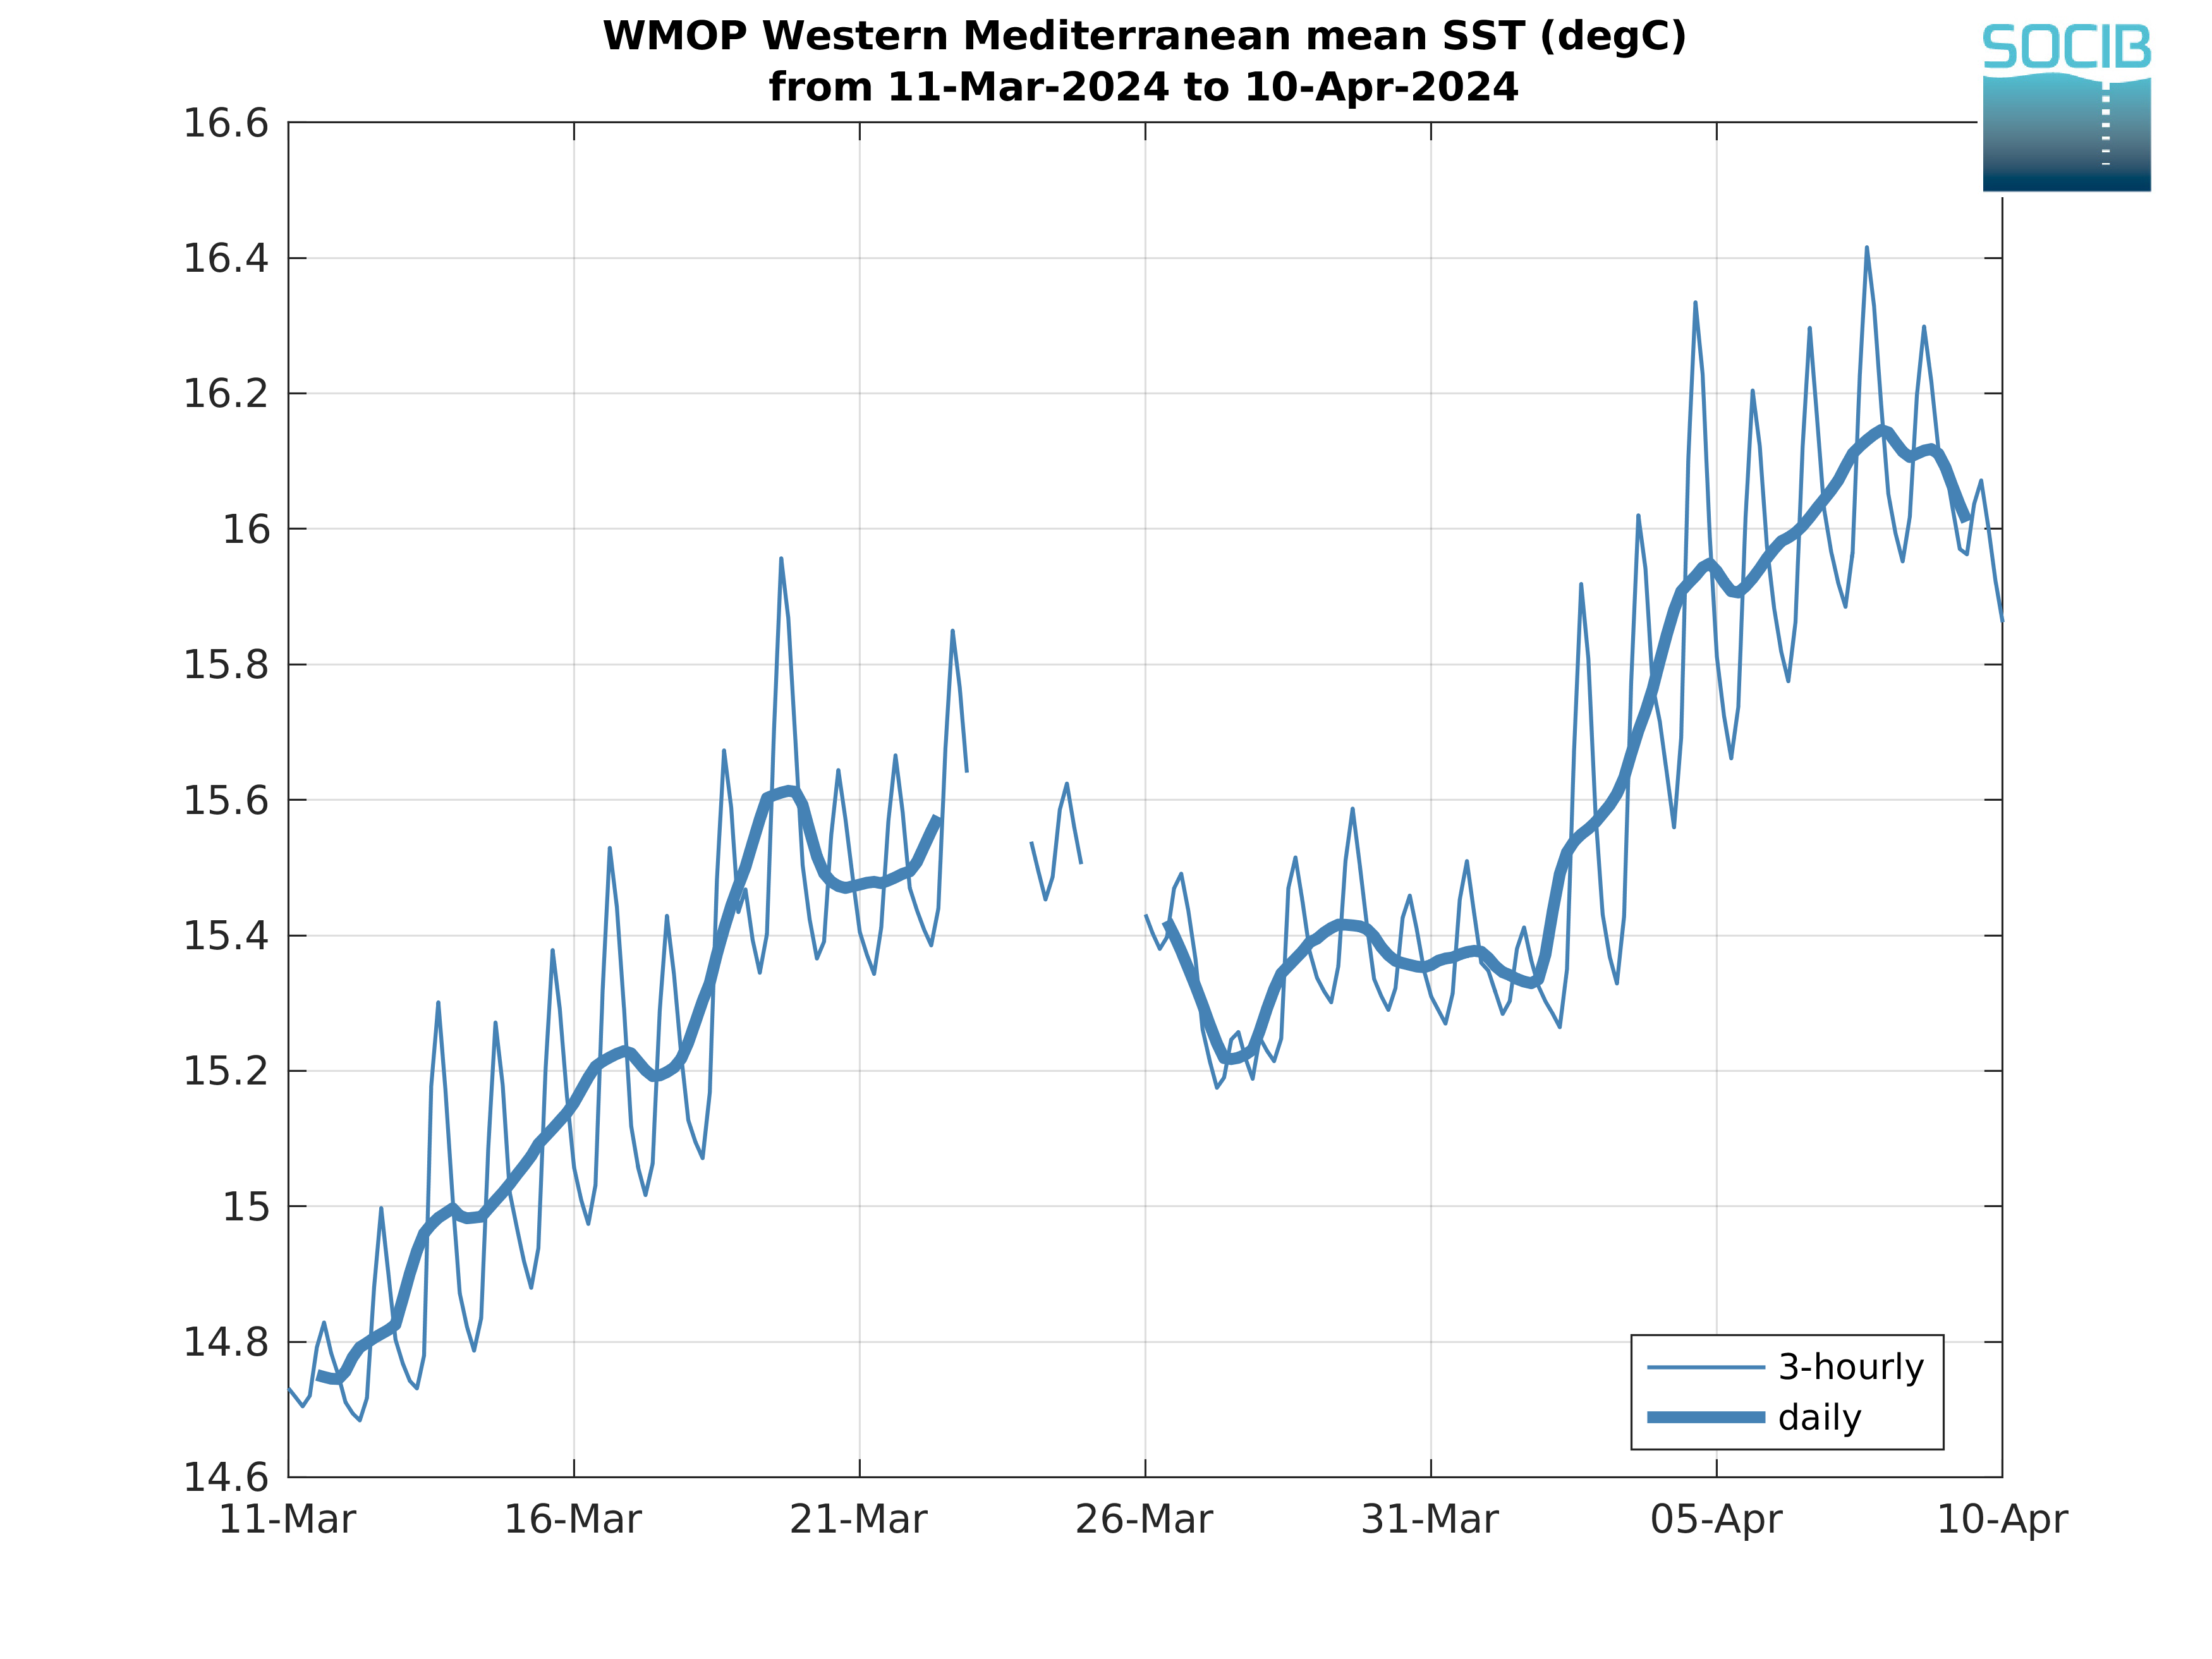
Sea Surface Temperature
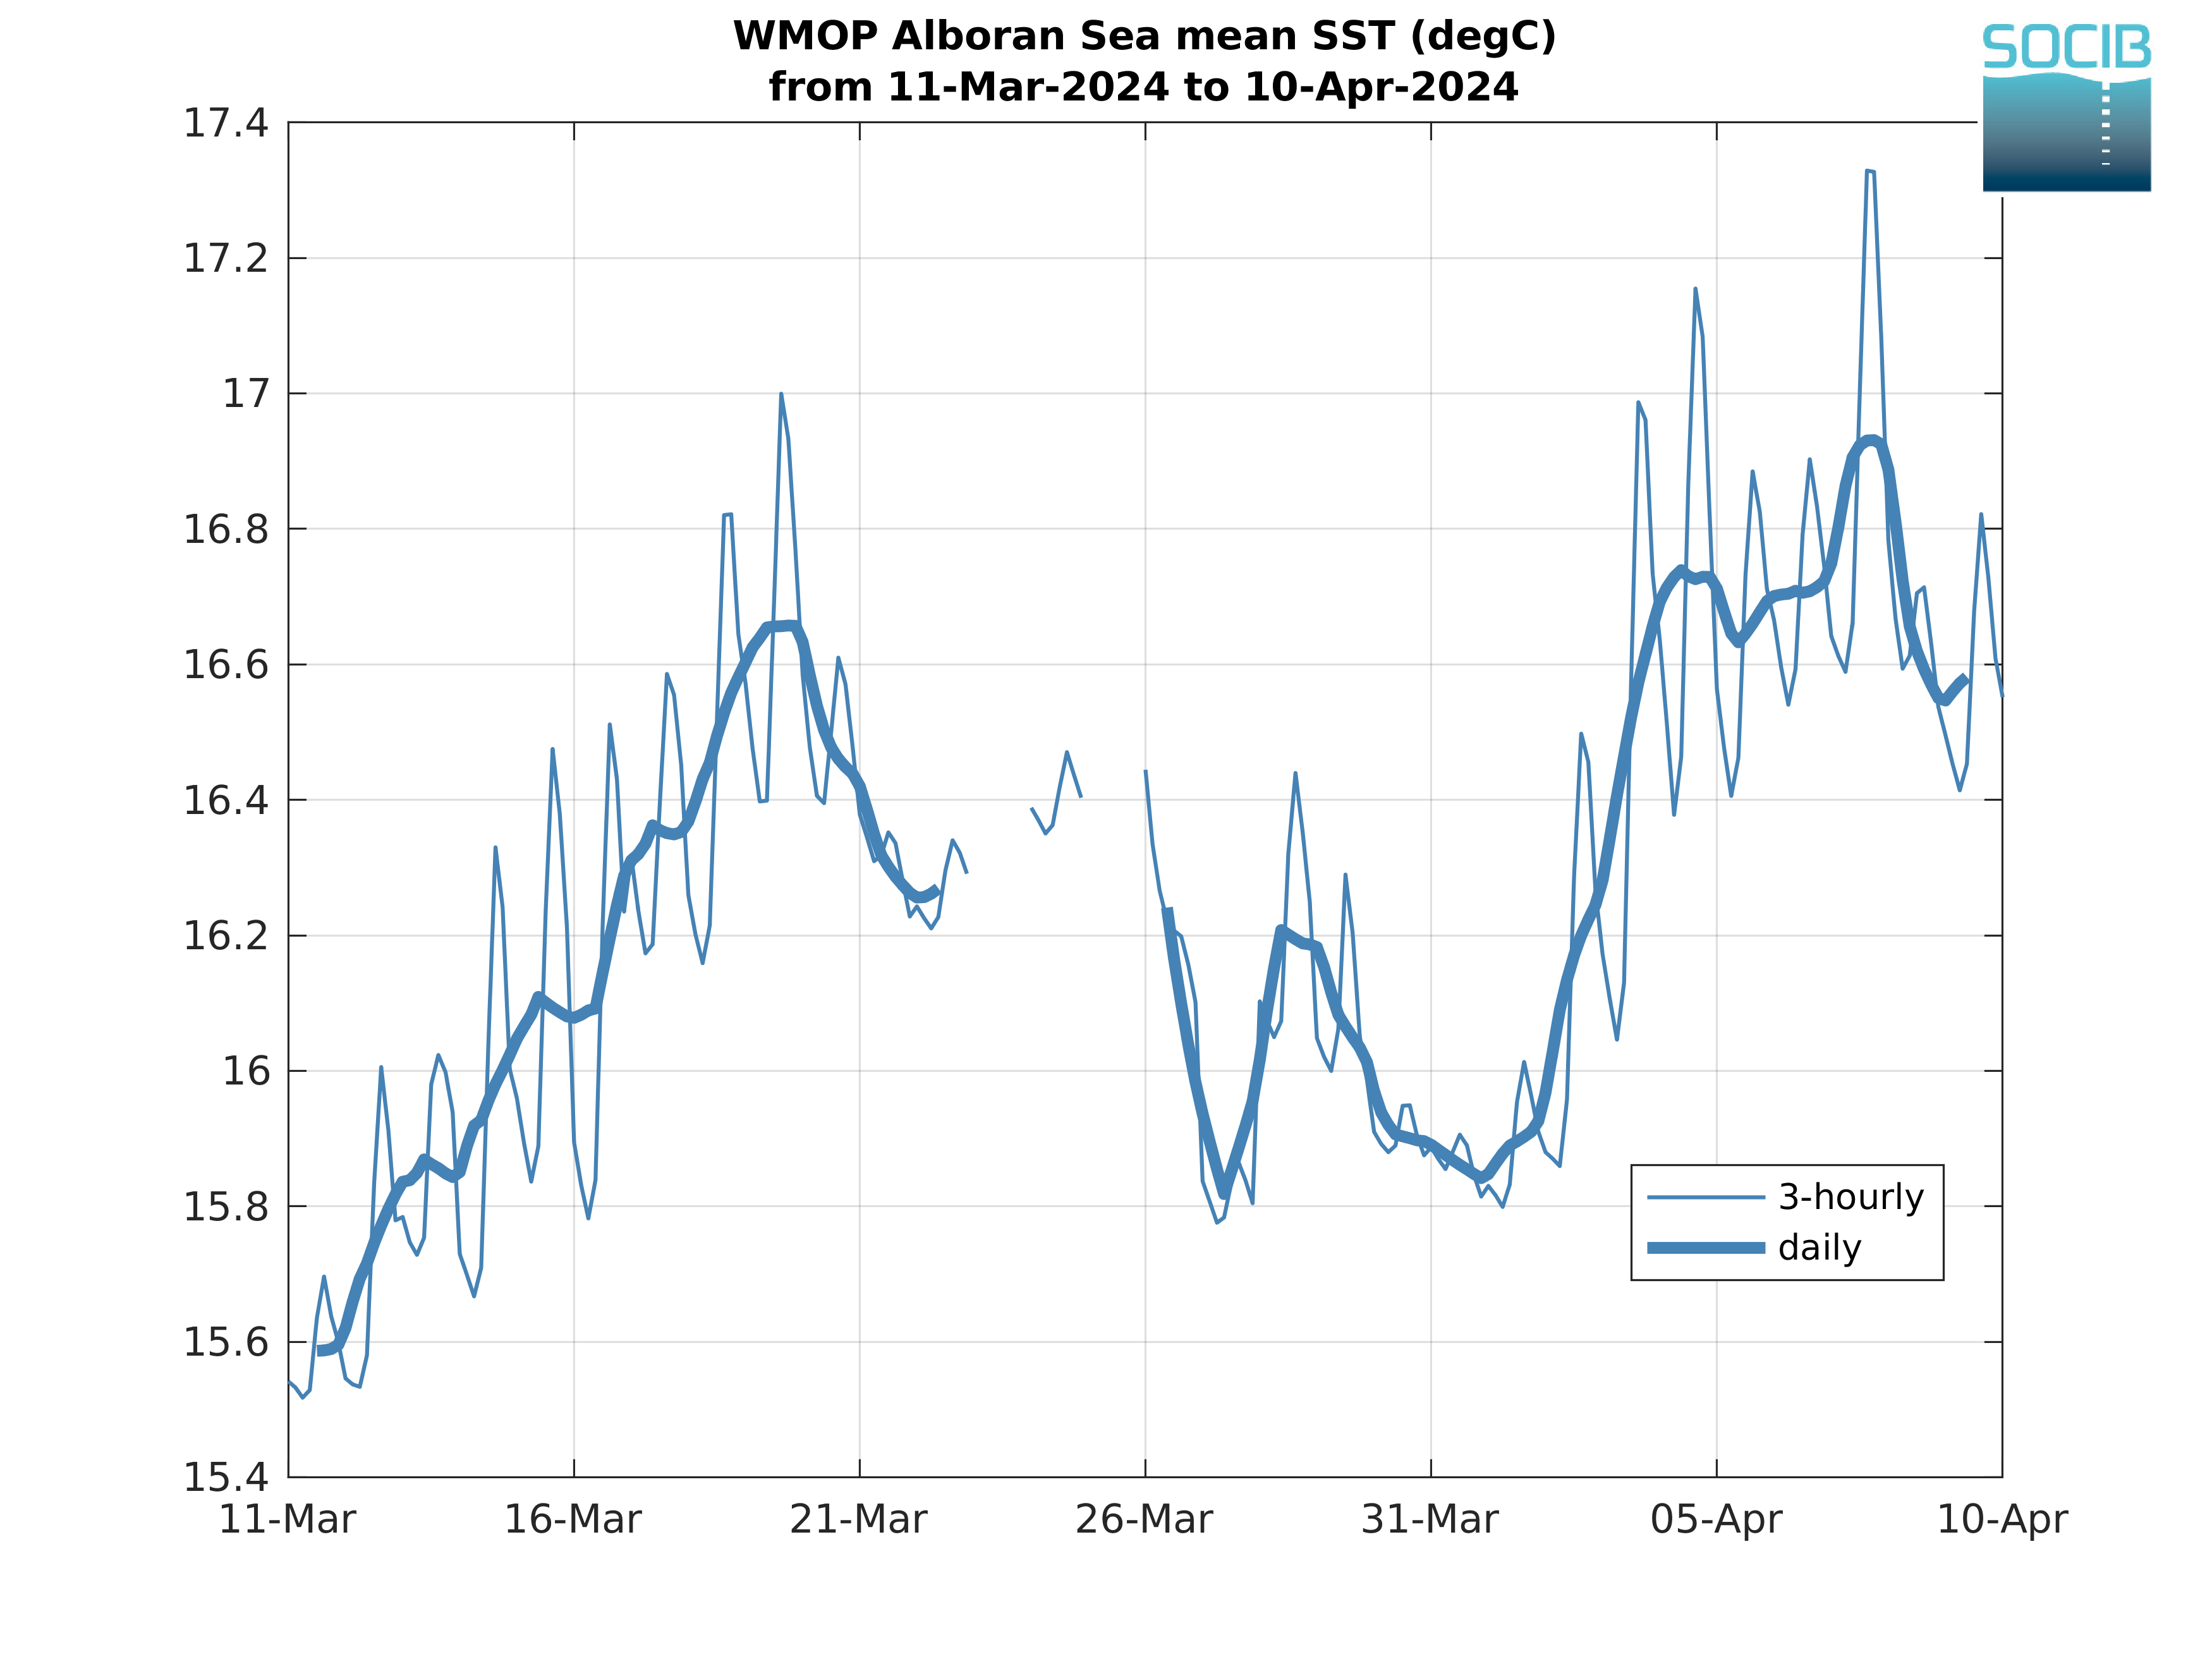
The Sea surface temperature (SST) is a crucial oceanic parameter for the exchanges of energy between the ocean and the atmosphere, for biological processes in the ocean, for fisheries and for a wide range of recreational activities. The temporal evolution of the spatially averaged SST is monitored in this section, both for the whole modeling domain and in the three sub-regions defined in Figure 1.
|
|
| Figure 1: WMOP daily mean SST | Figure 2: WMOP spatially averaged SST over the last 30 days |
|

|

|
| Figure 3: WMOP spatially averaged SST over the last 30 days in the Alboran Sea | Figure 4: WMOP spatially averaged SST over the last 30 days in the Balearic Sea | Figure 5: WMOP spatially averaged SST over the last 30 days in the Gulf of Lion |
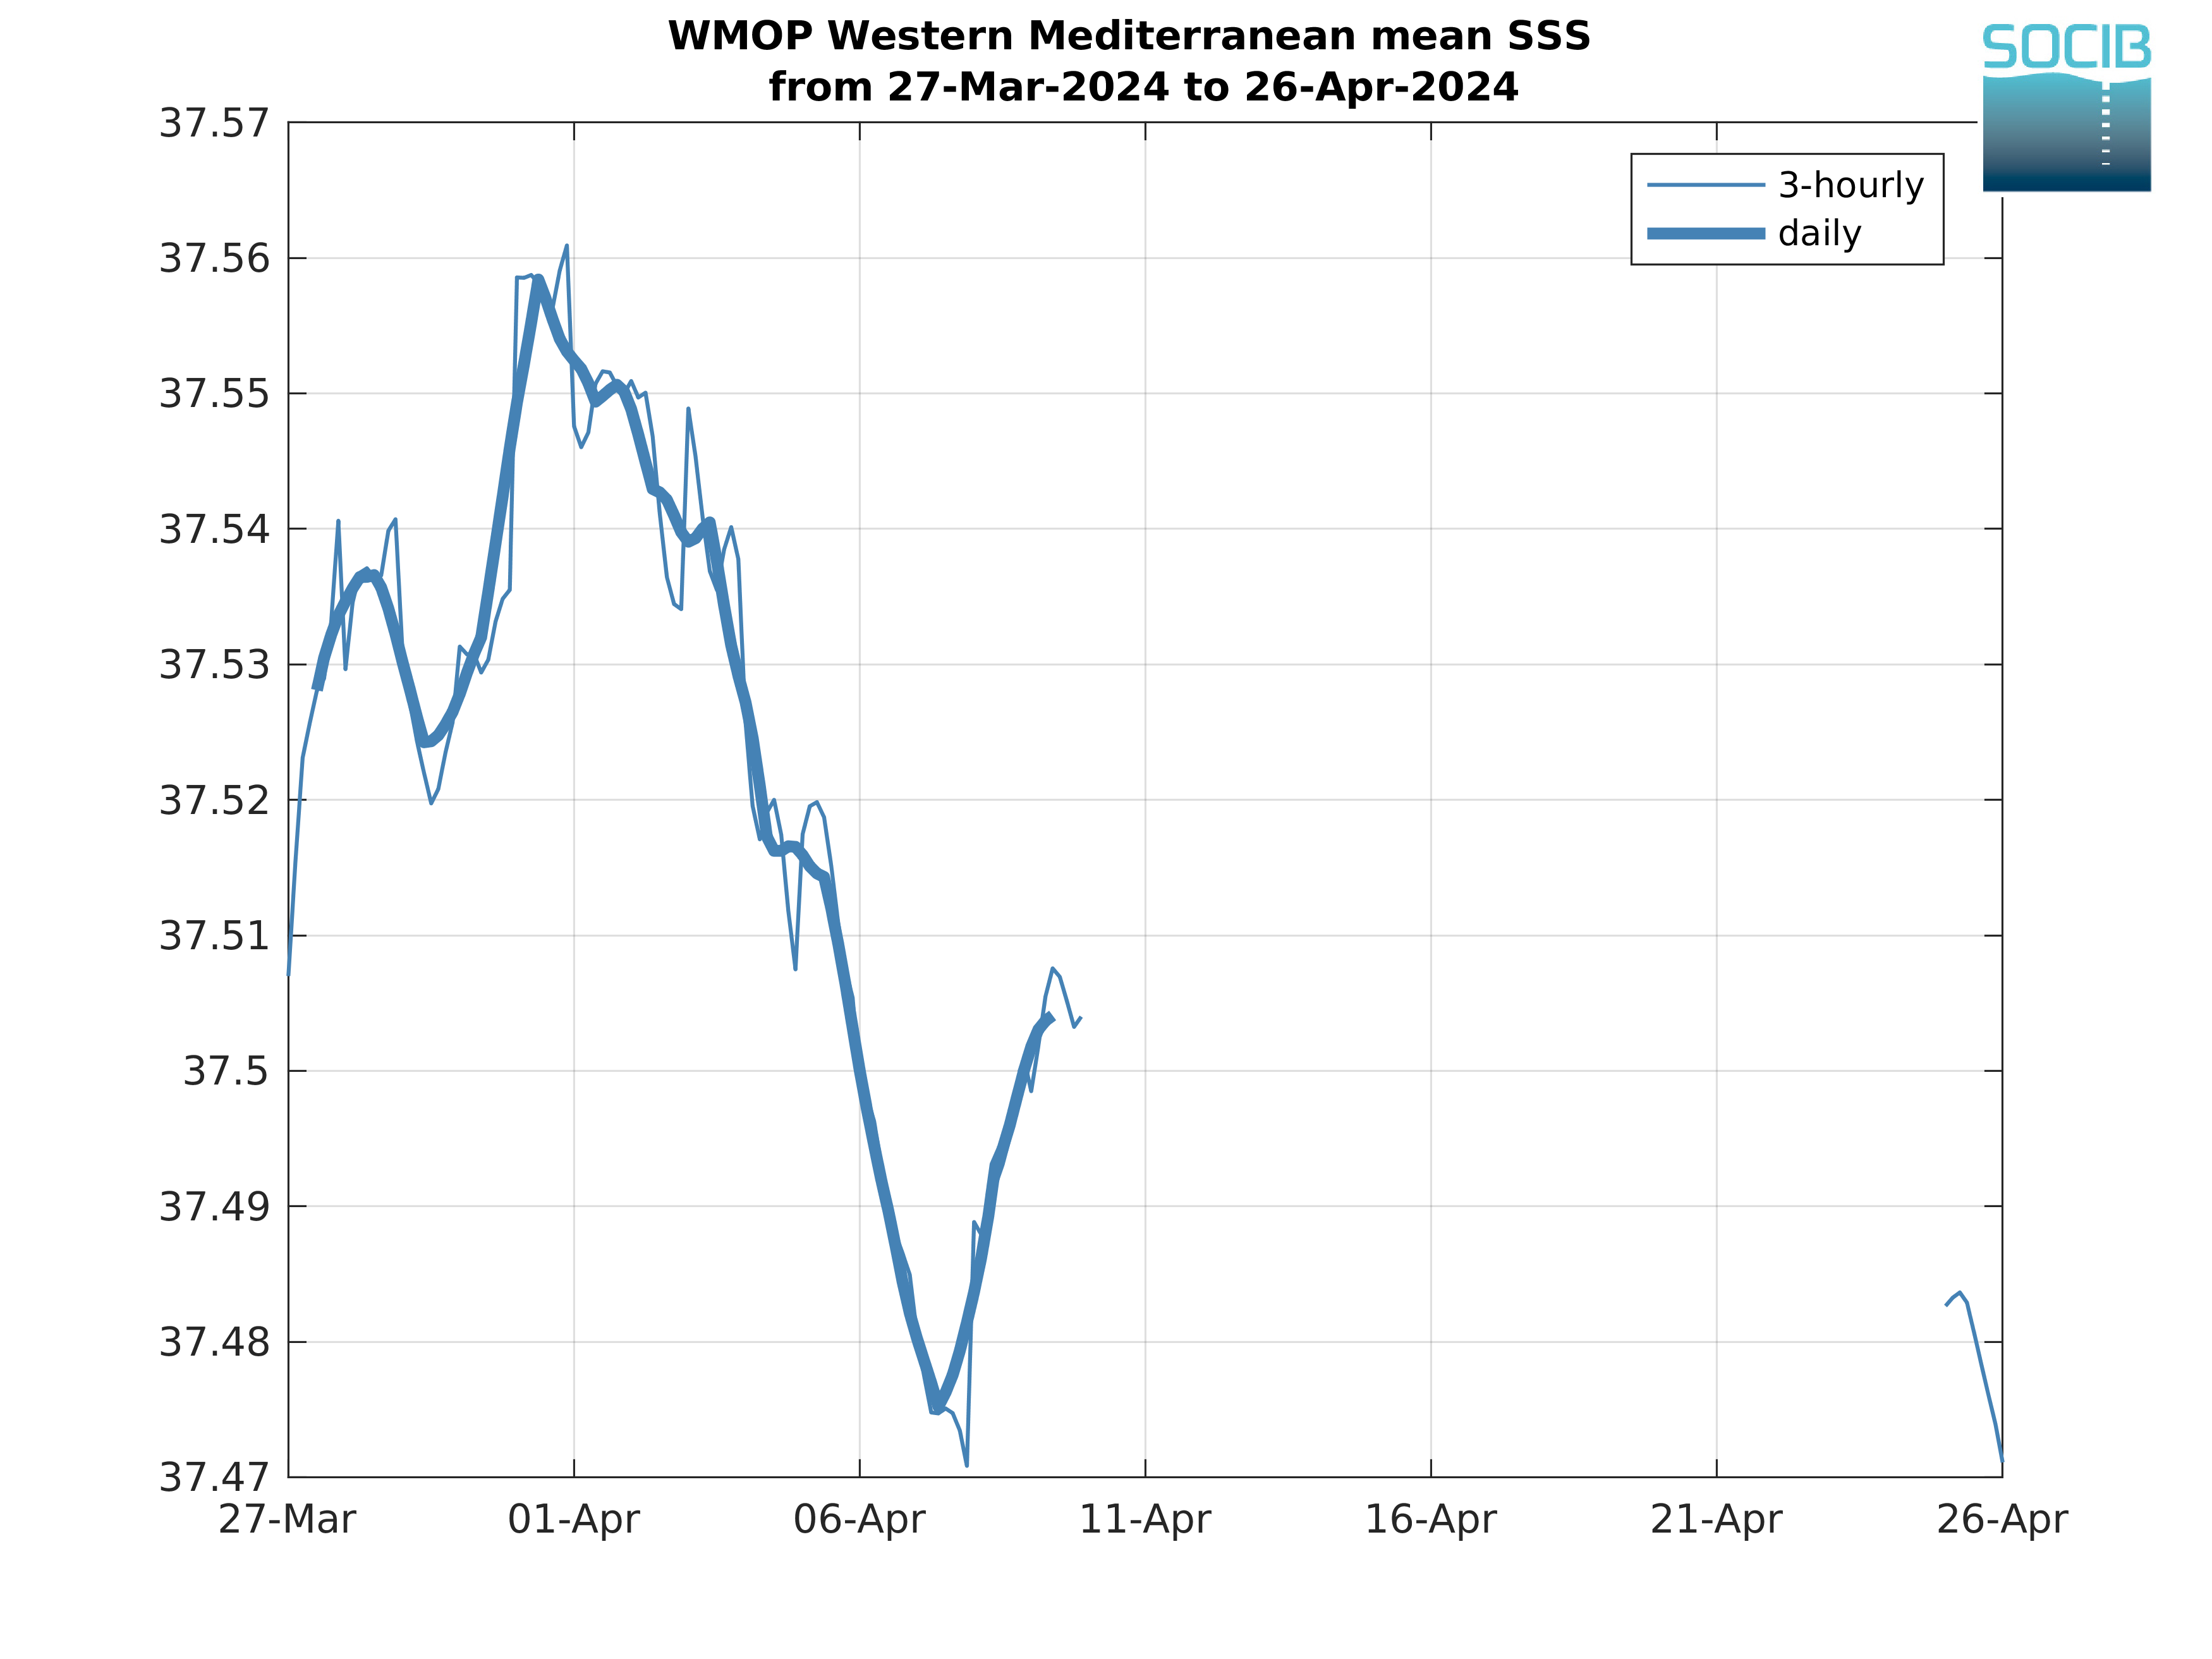
Sea Surface Salinity

|
|
| Figure 1: WMOP daily mean SSS | Figure 2: WMOP spatially averaged SSS over the last 30 days |
|
|
|
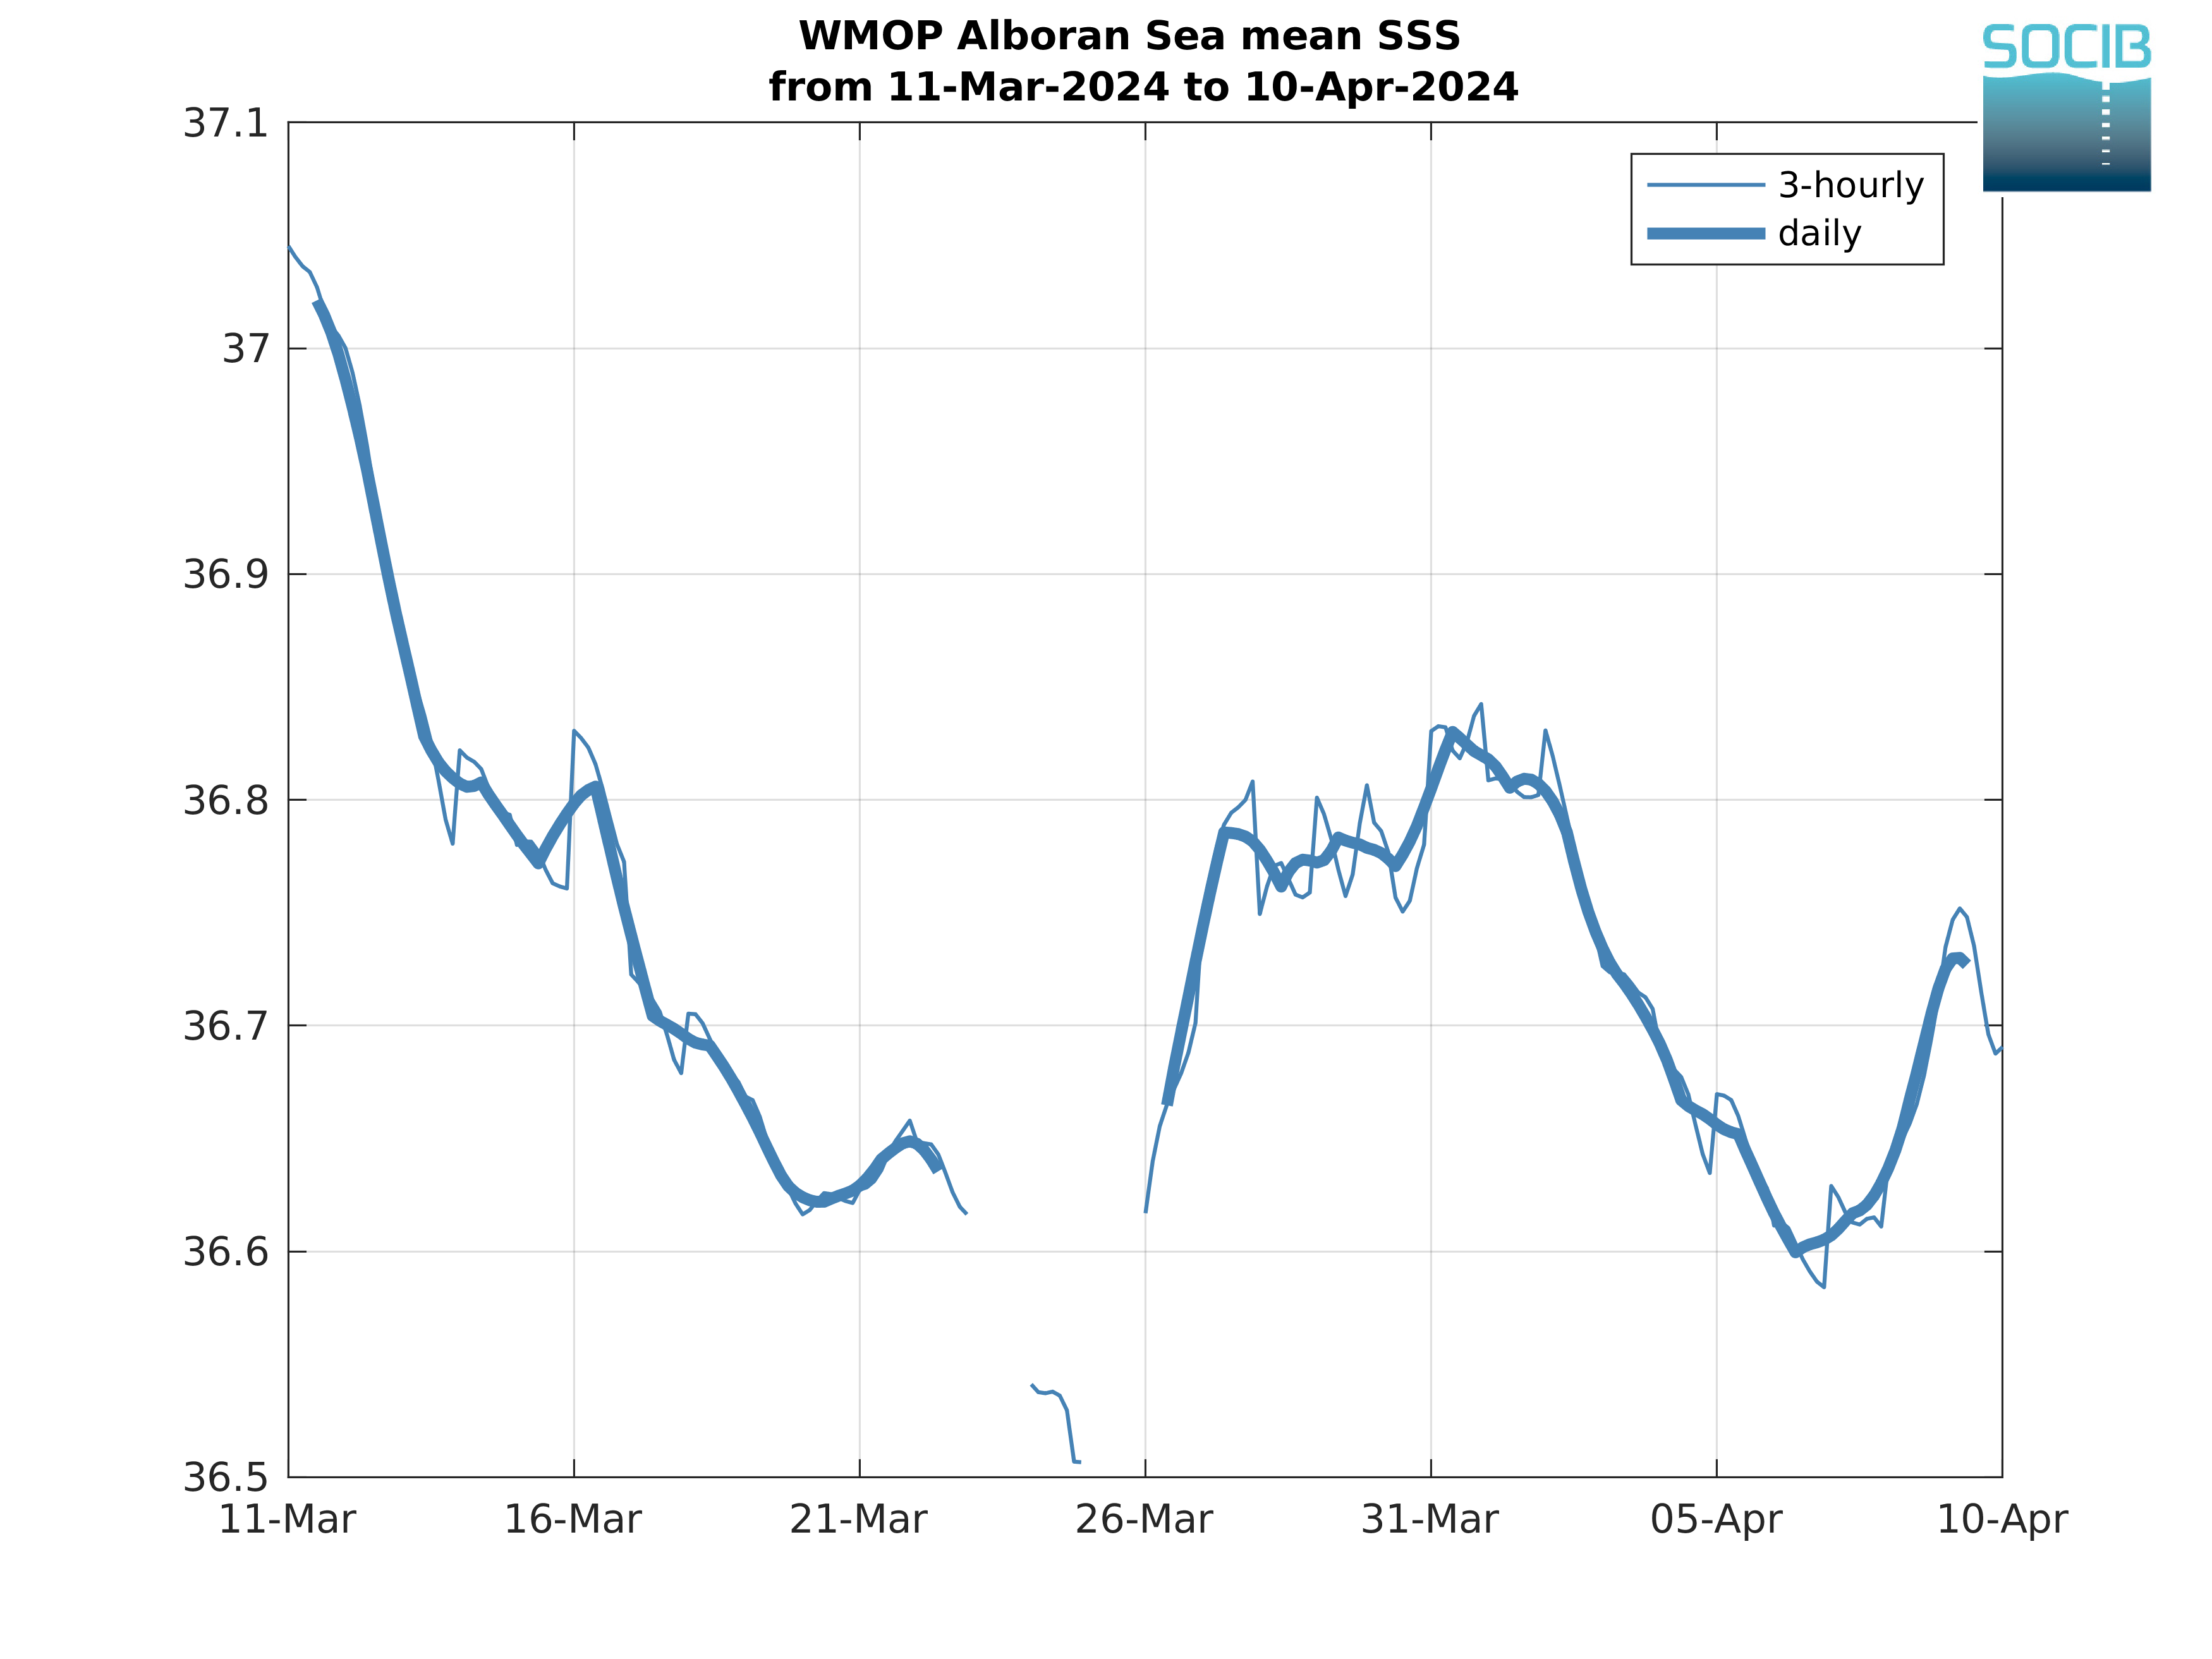
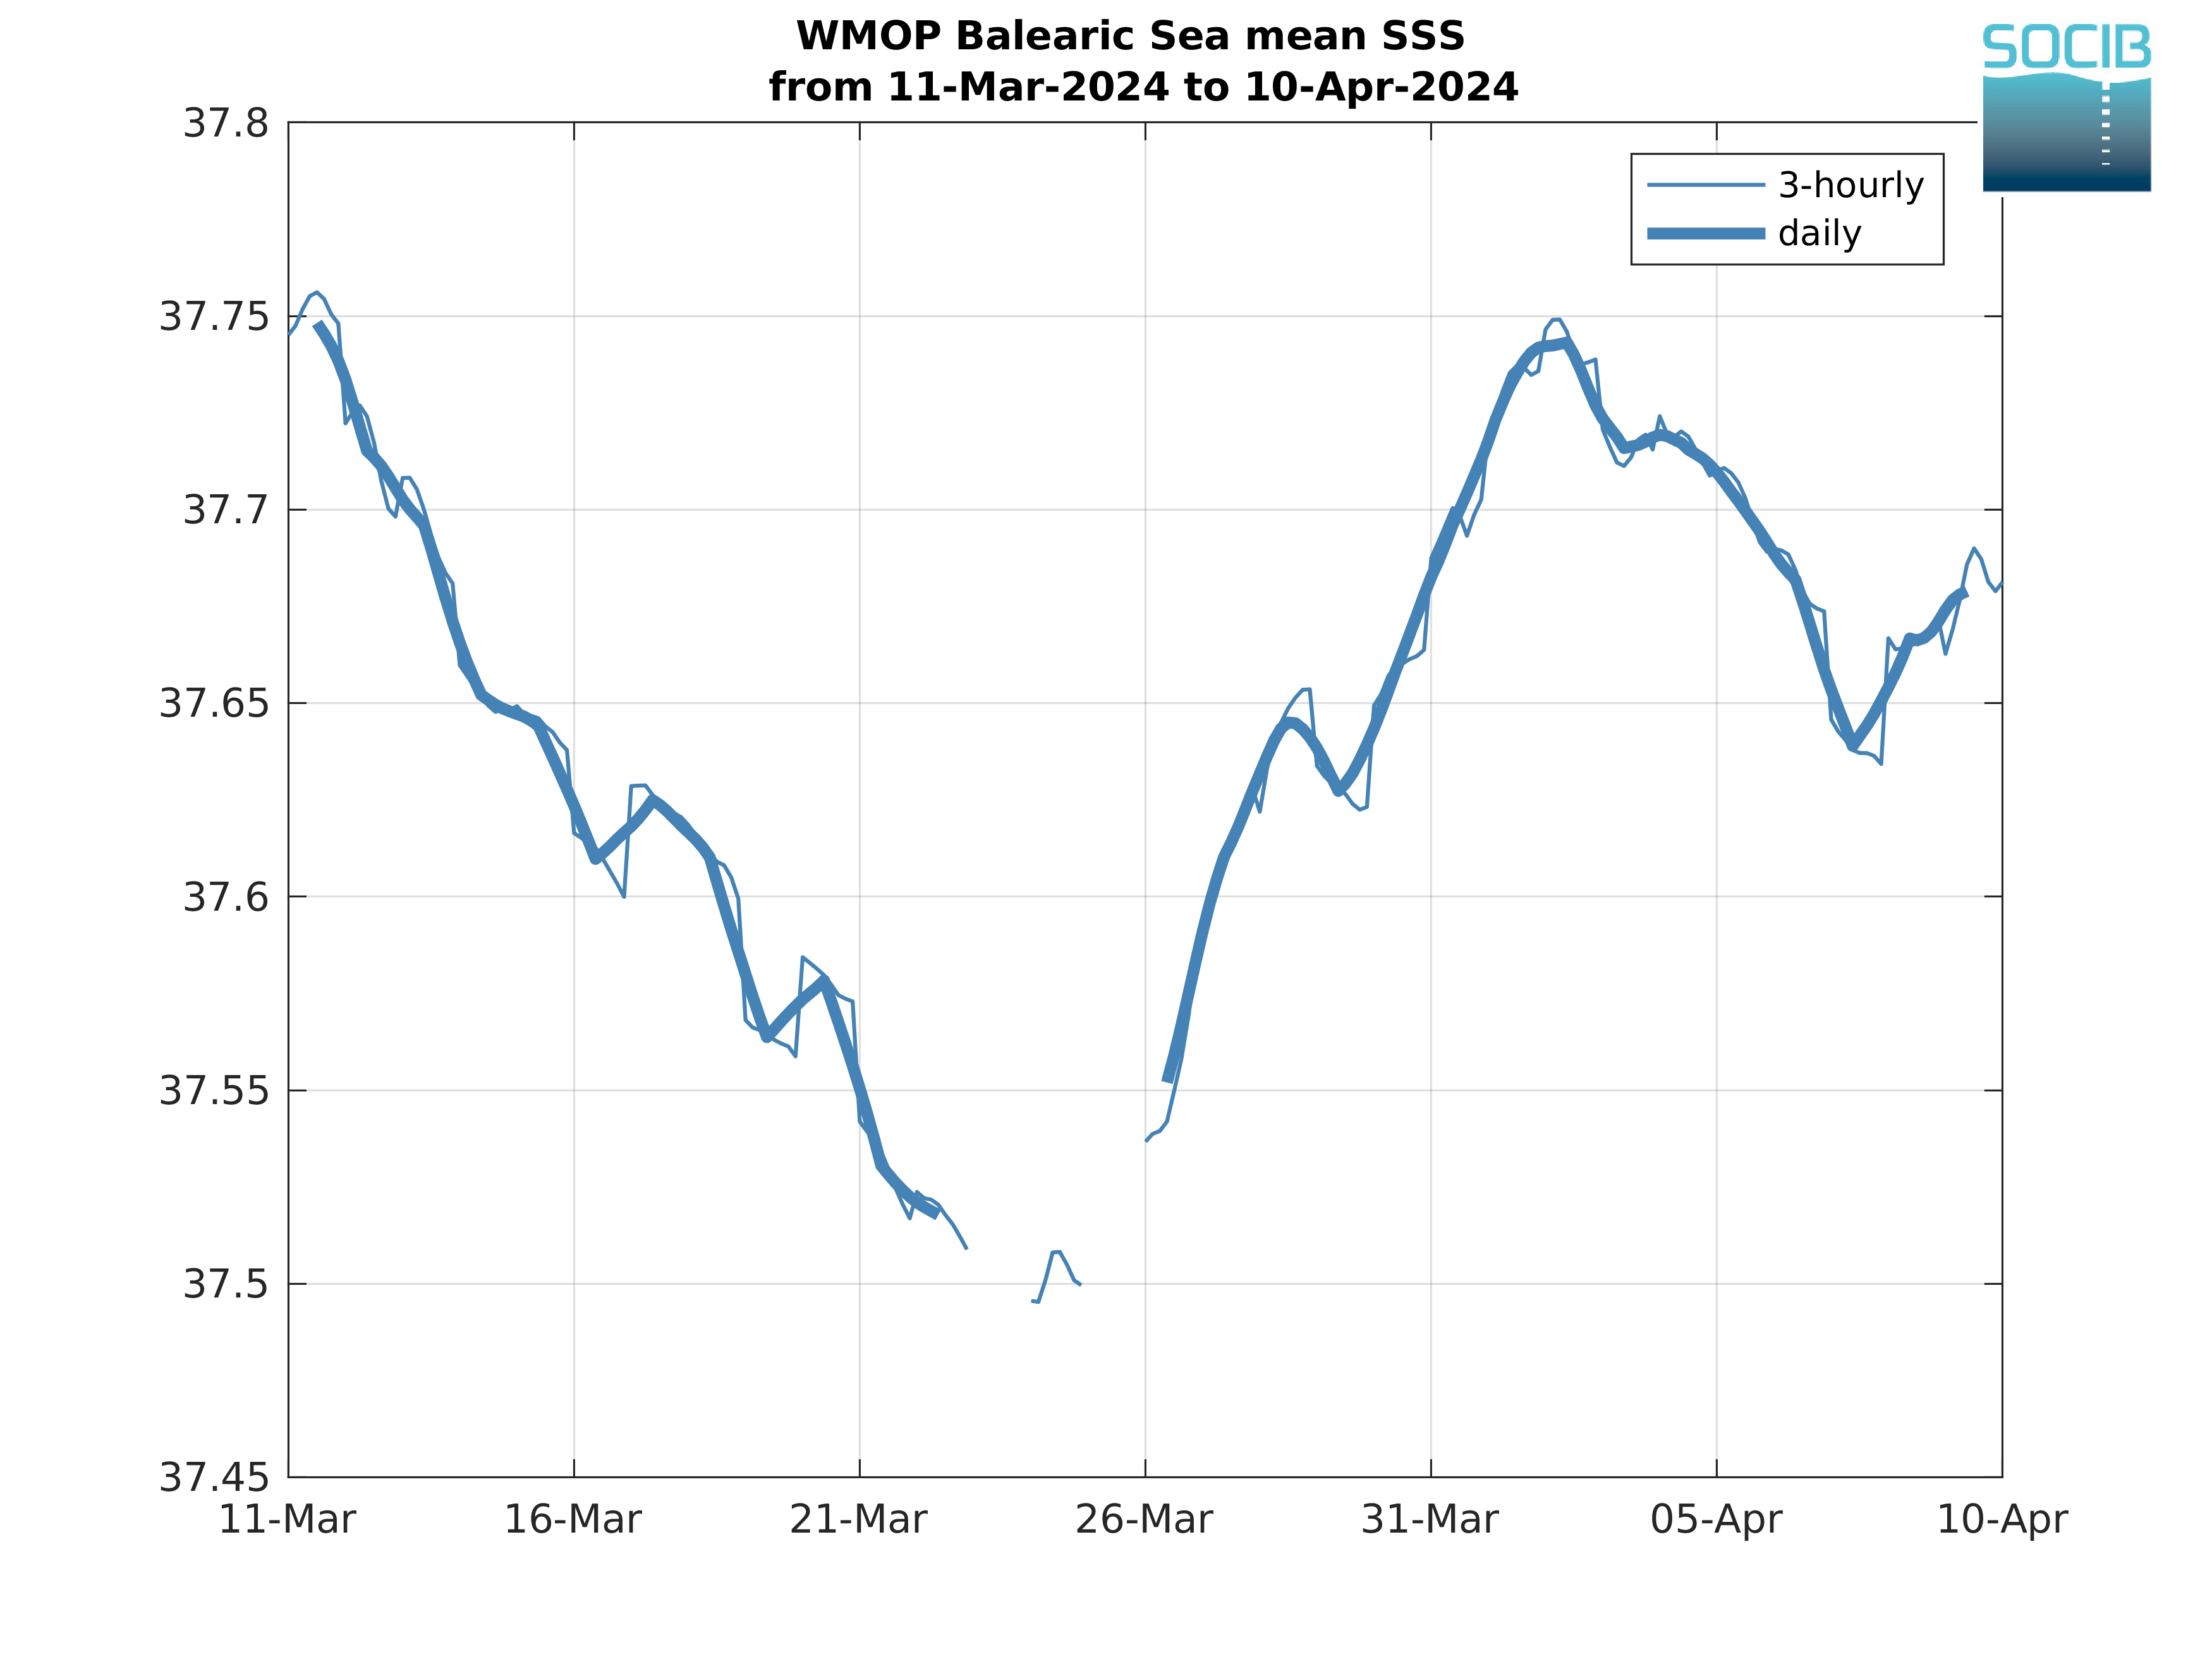
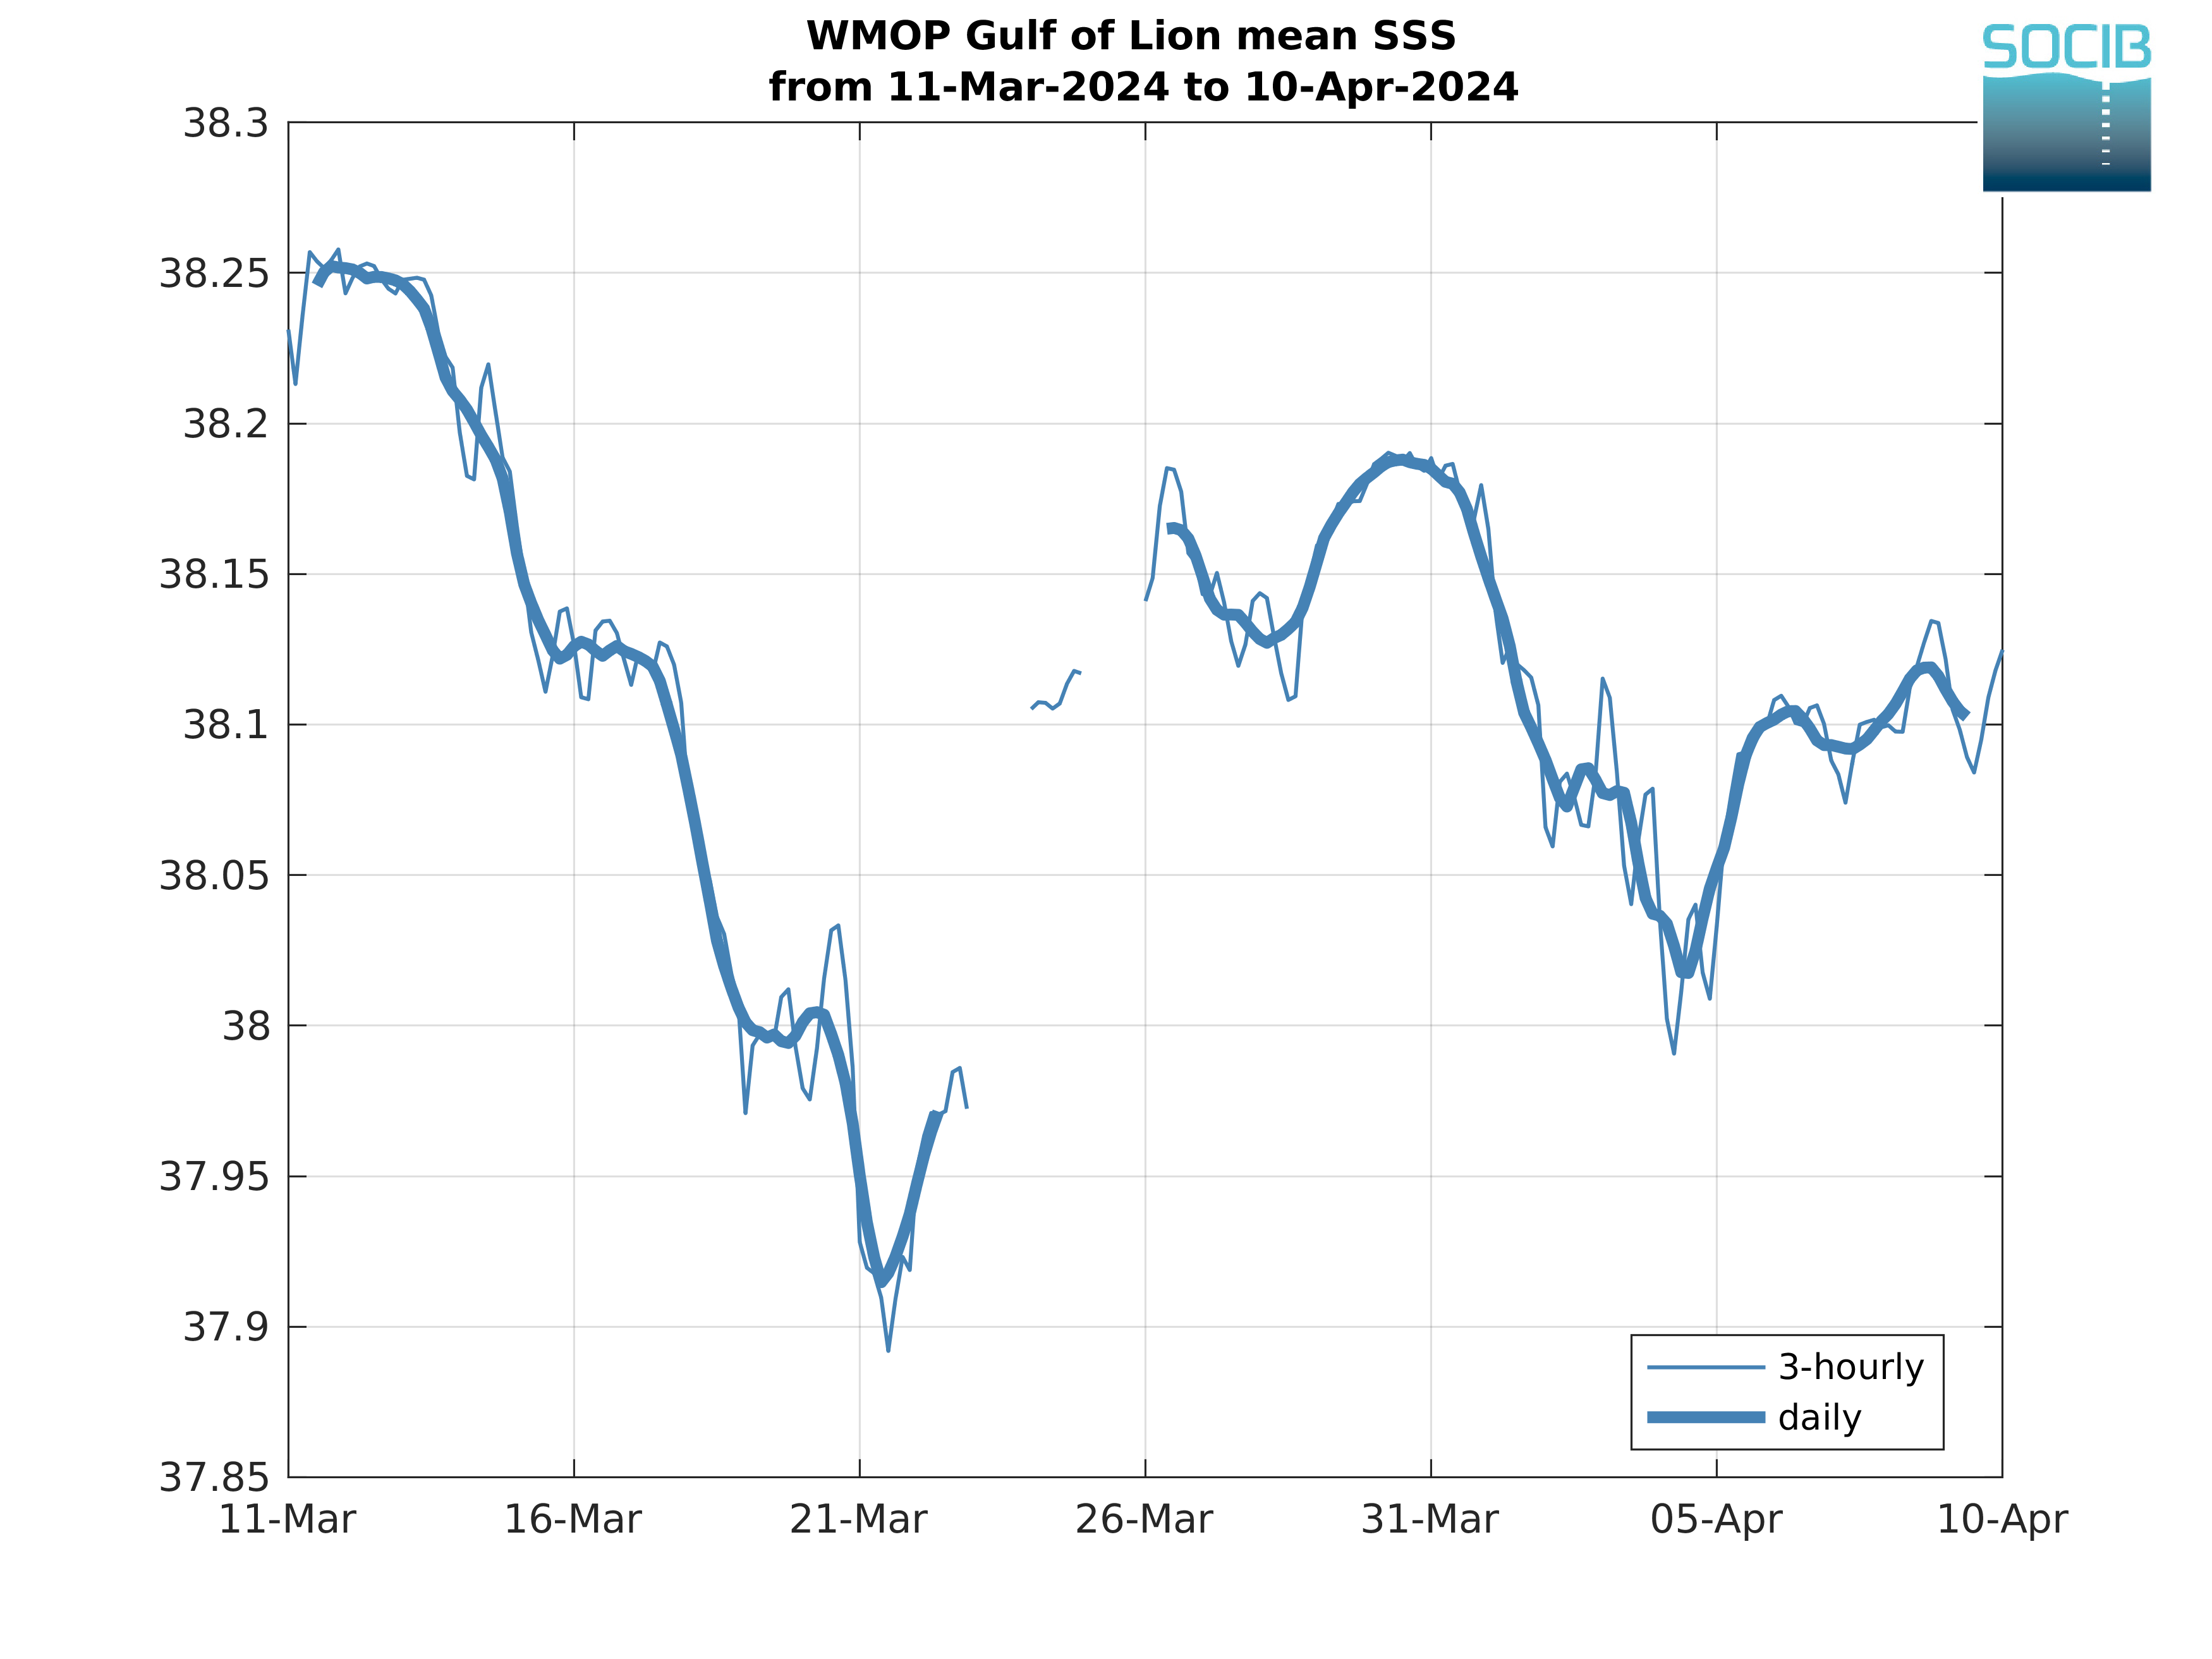
| Figure 3: WMOP spatially averaged SSS over the last 30 days in the Alboran Sea | Figure 4: WMOP spatially averaged SSS over the last 30 days in the Balearic Sea | Figure 5: WMOP spatially averaged SSS over the last 30 days in the Gulf of Lion |
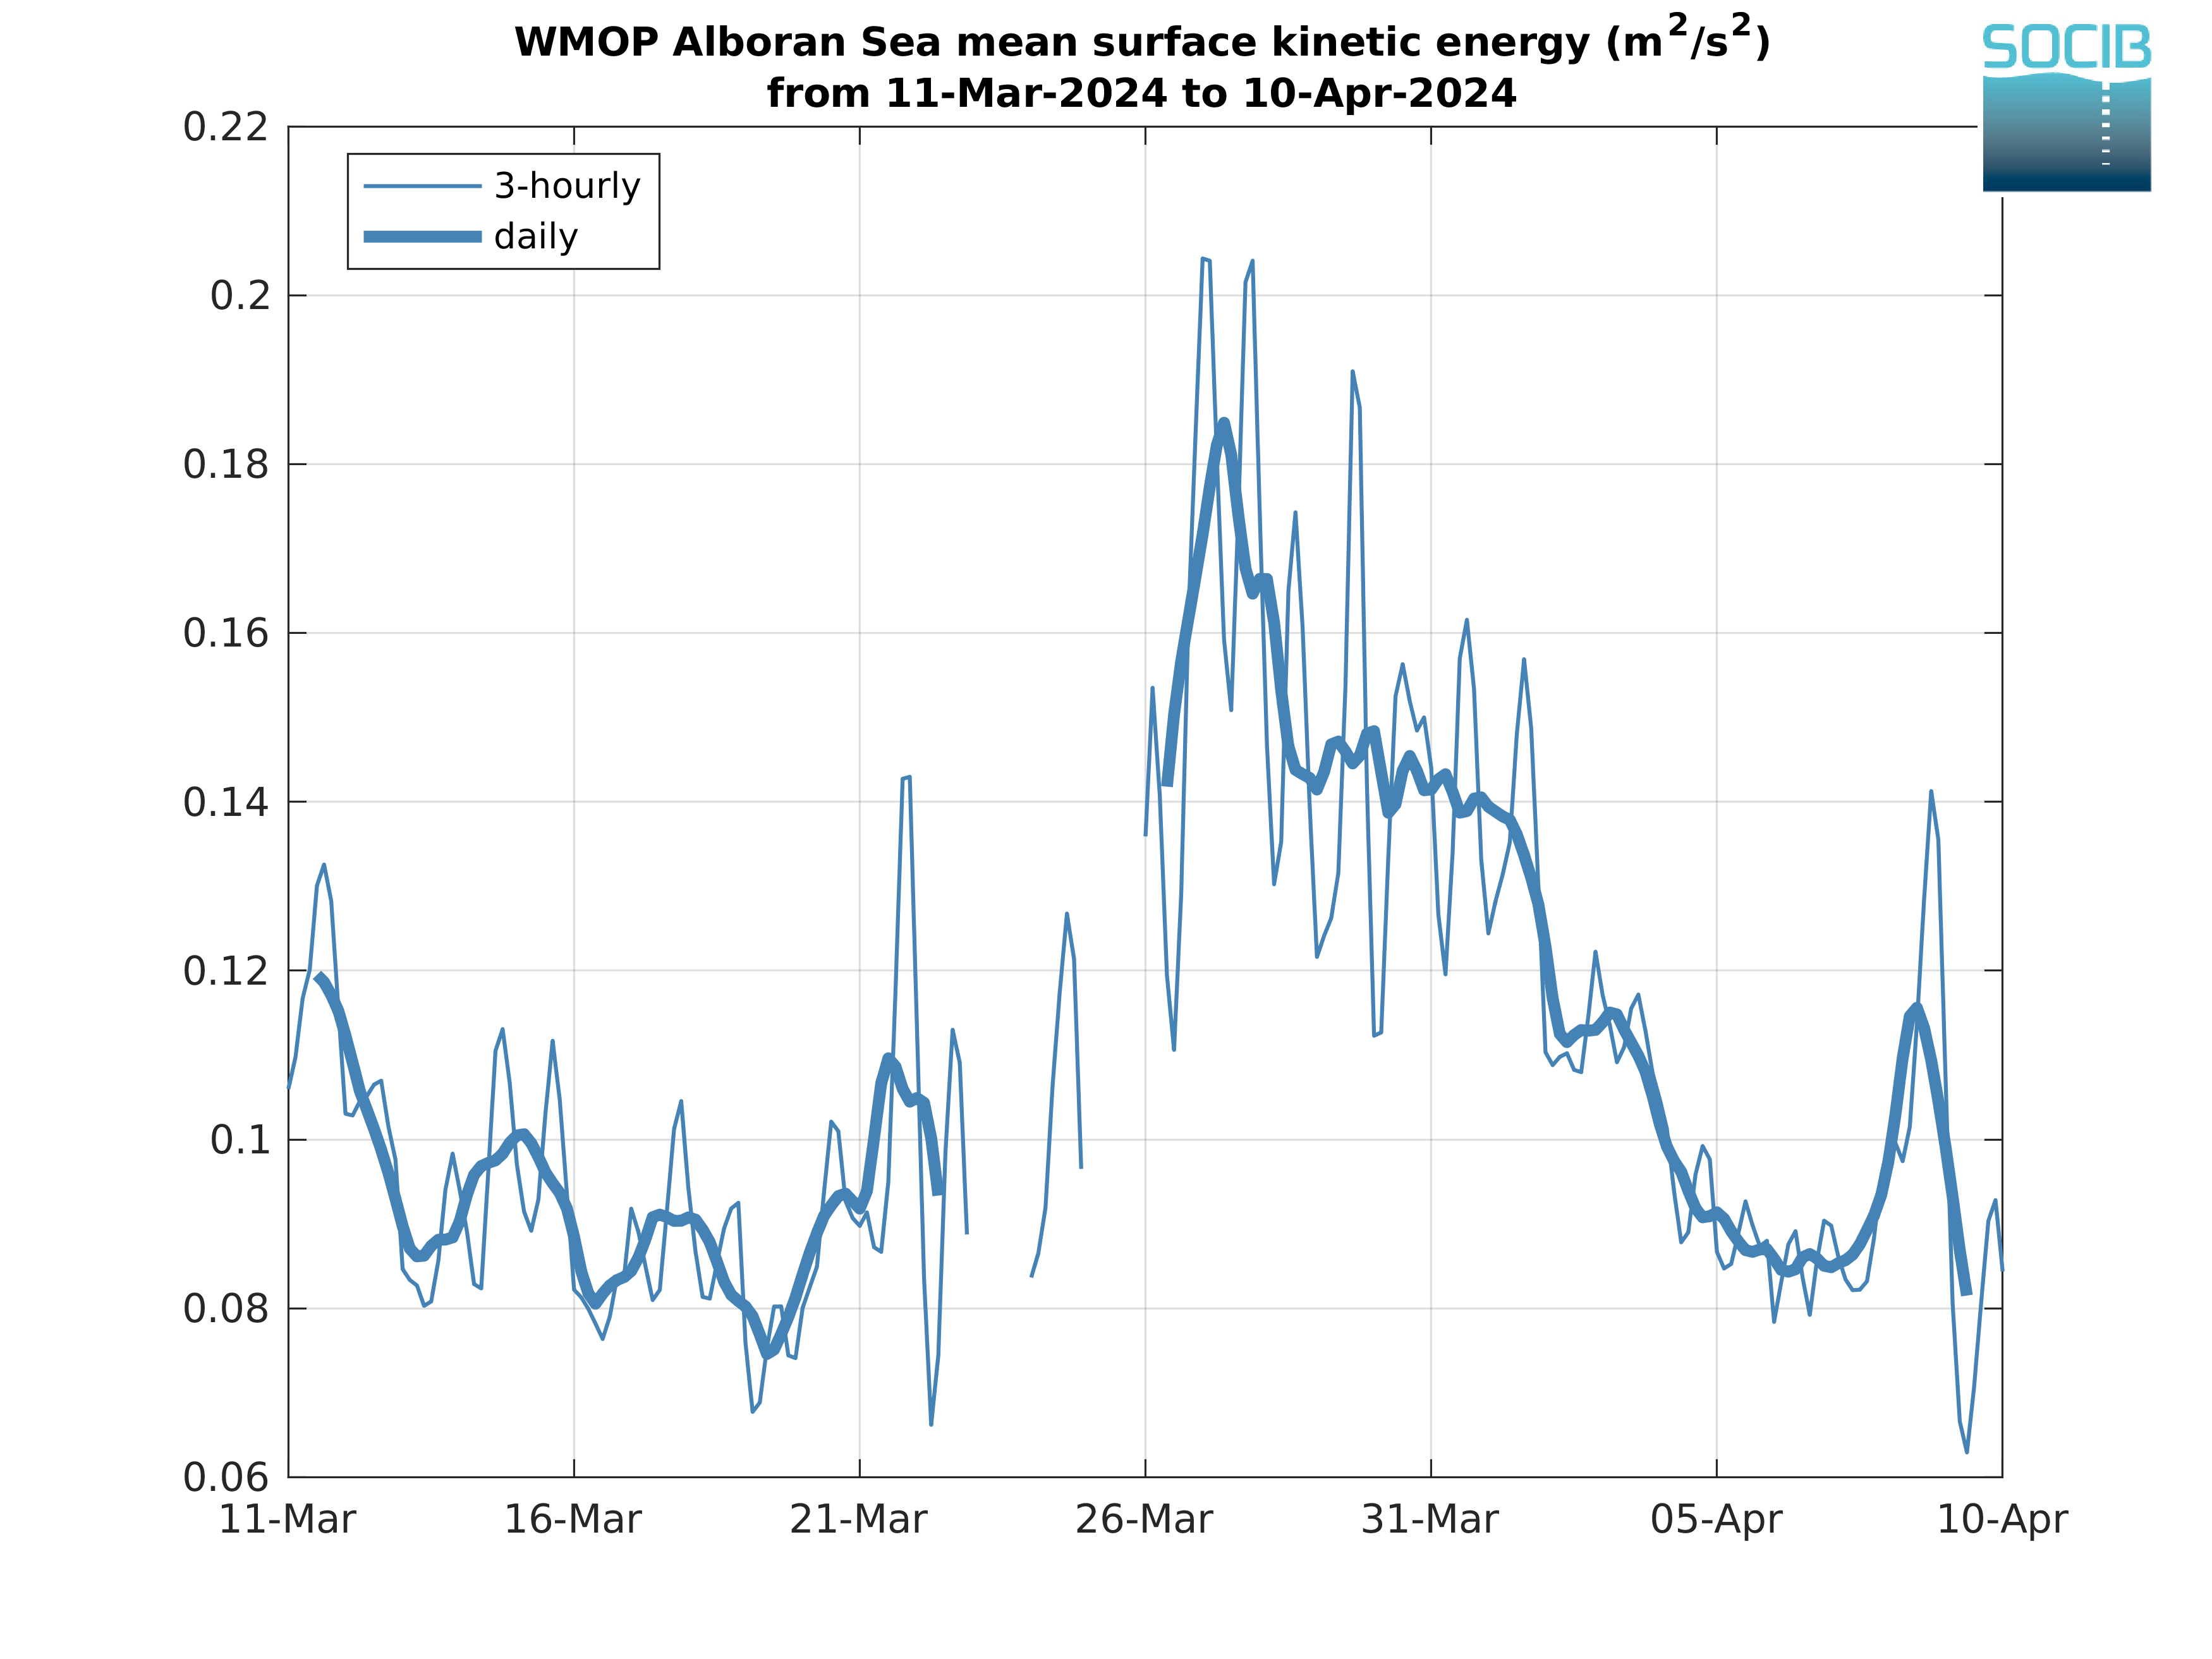
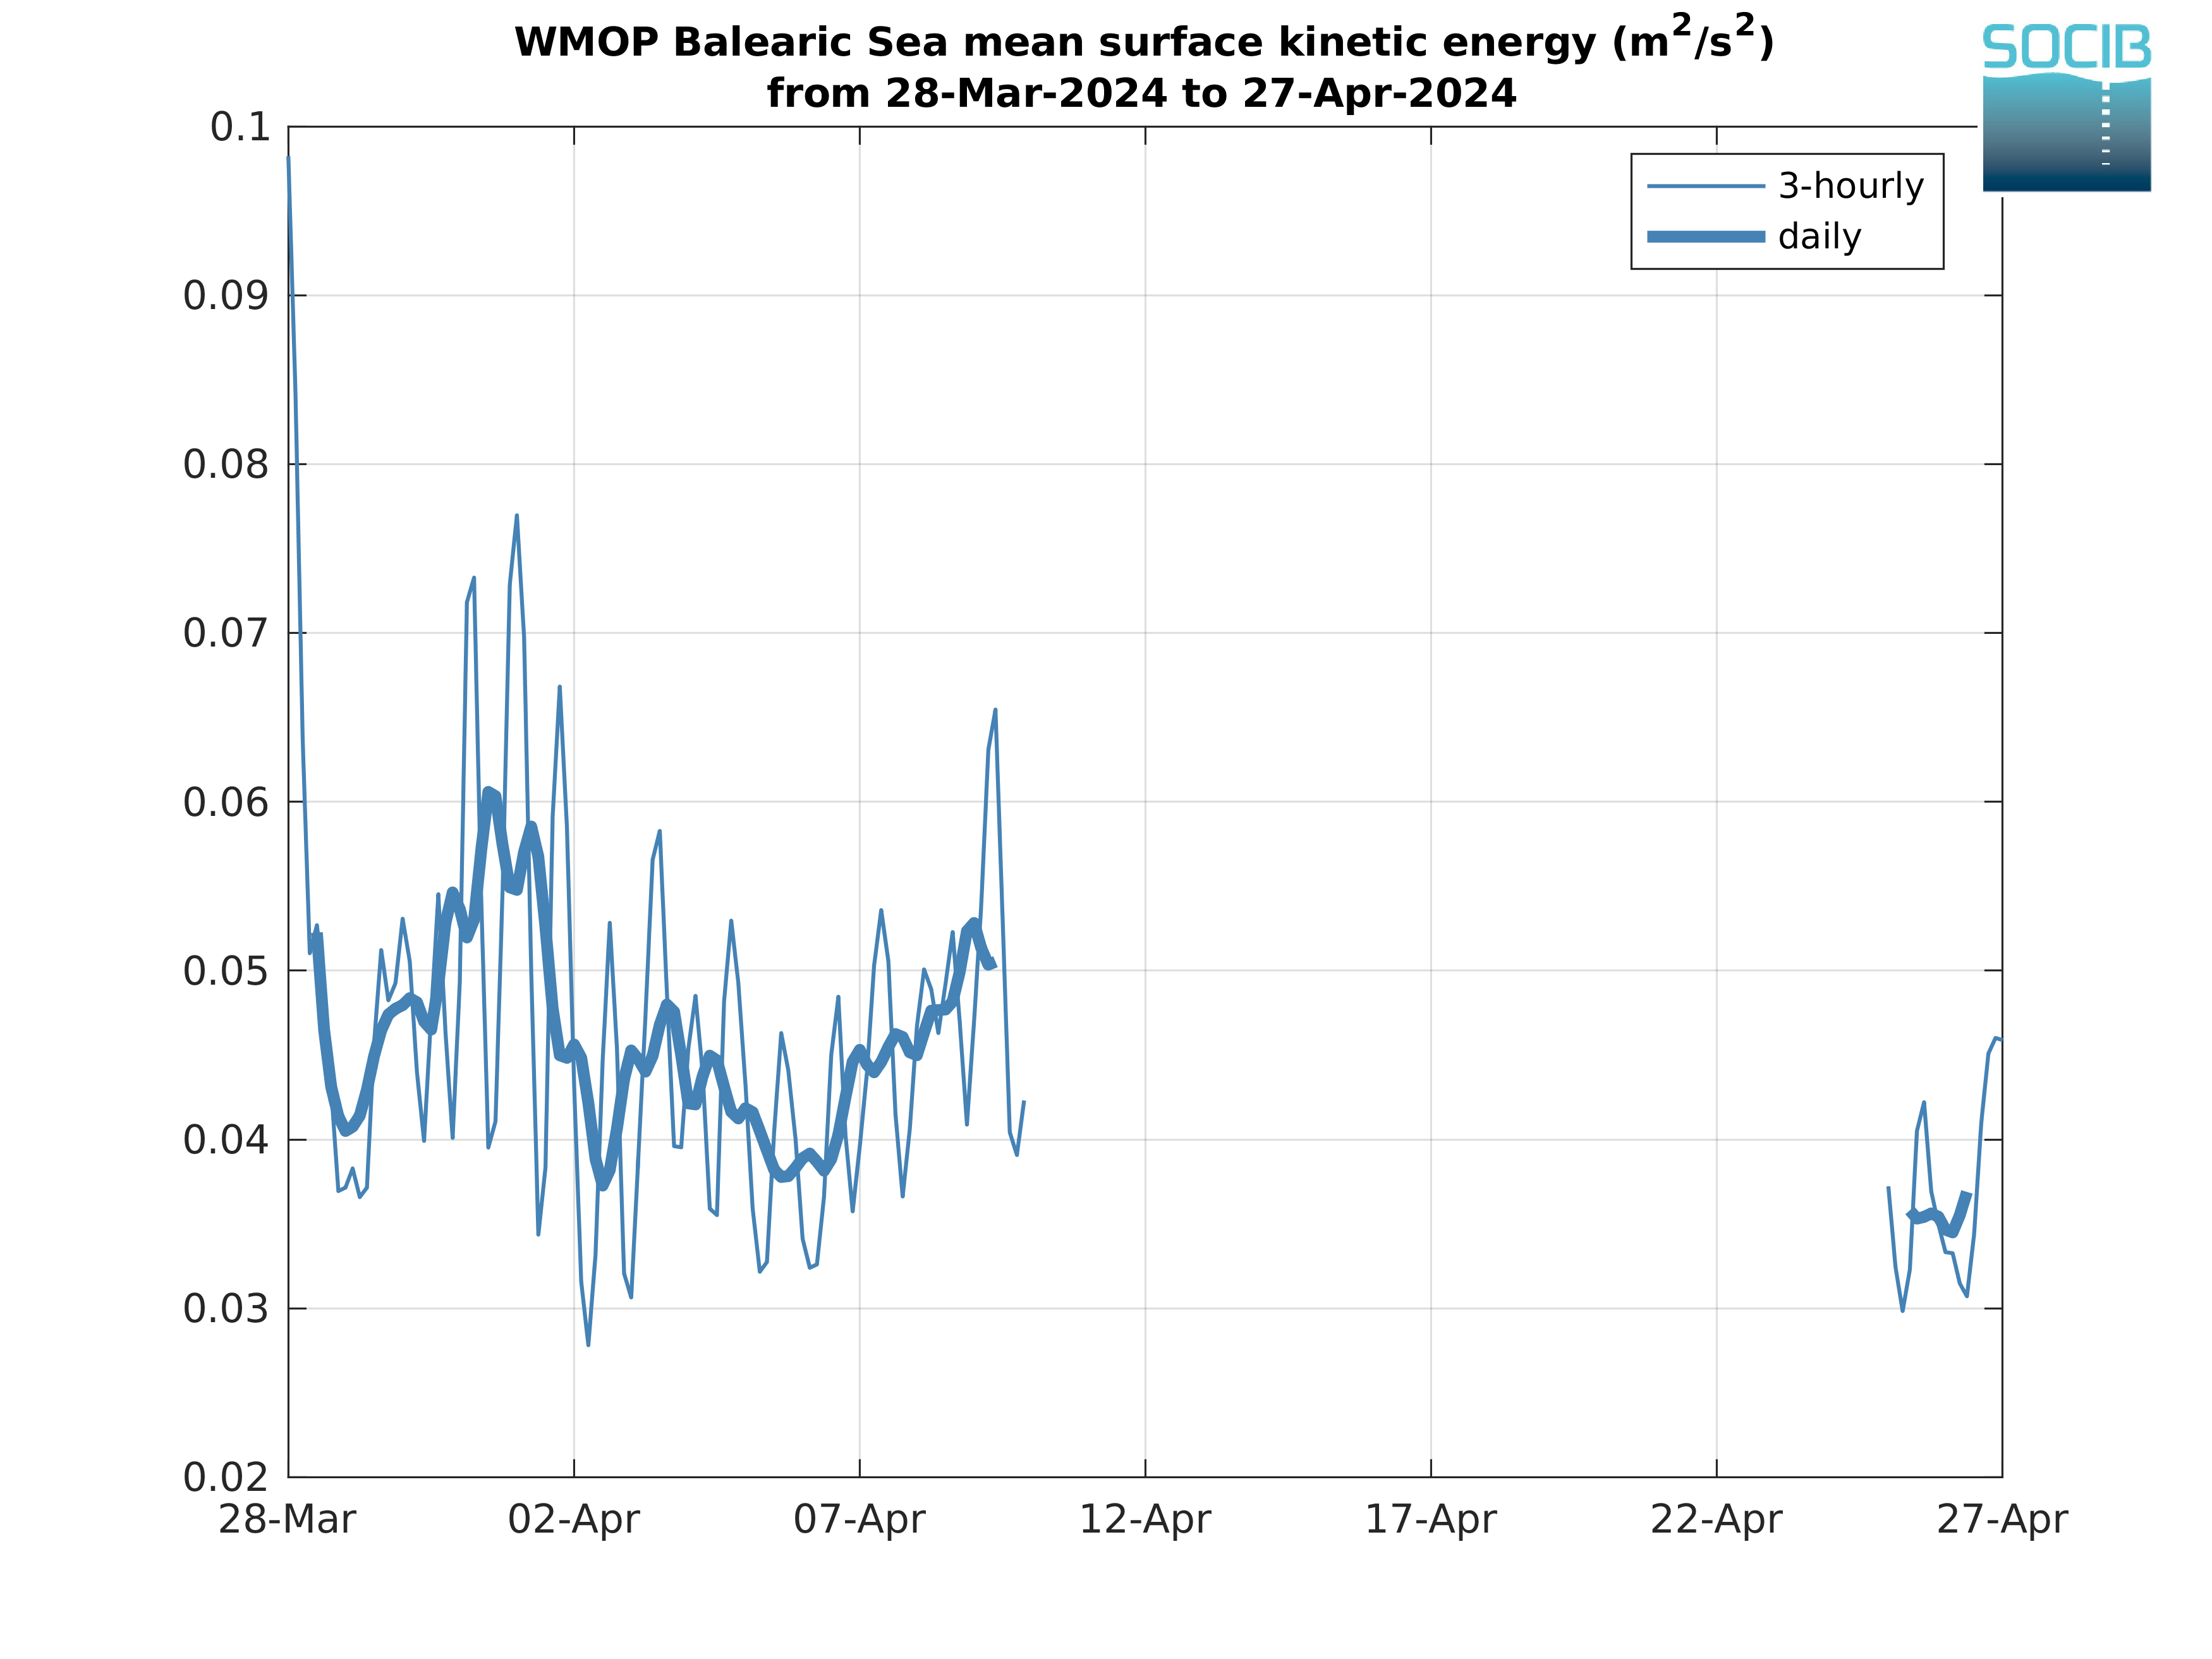
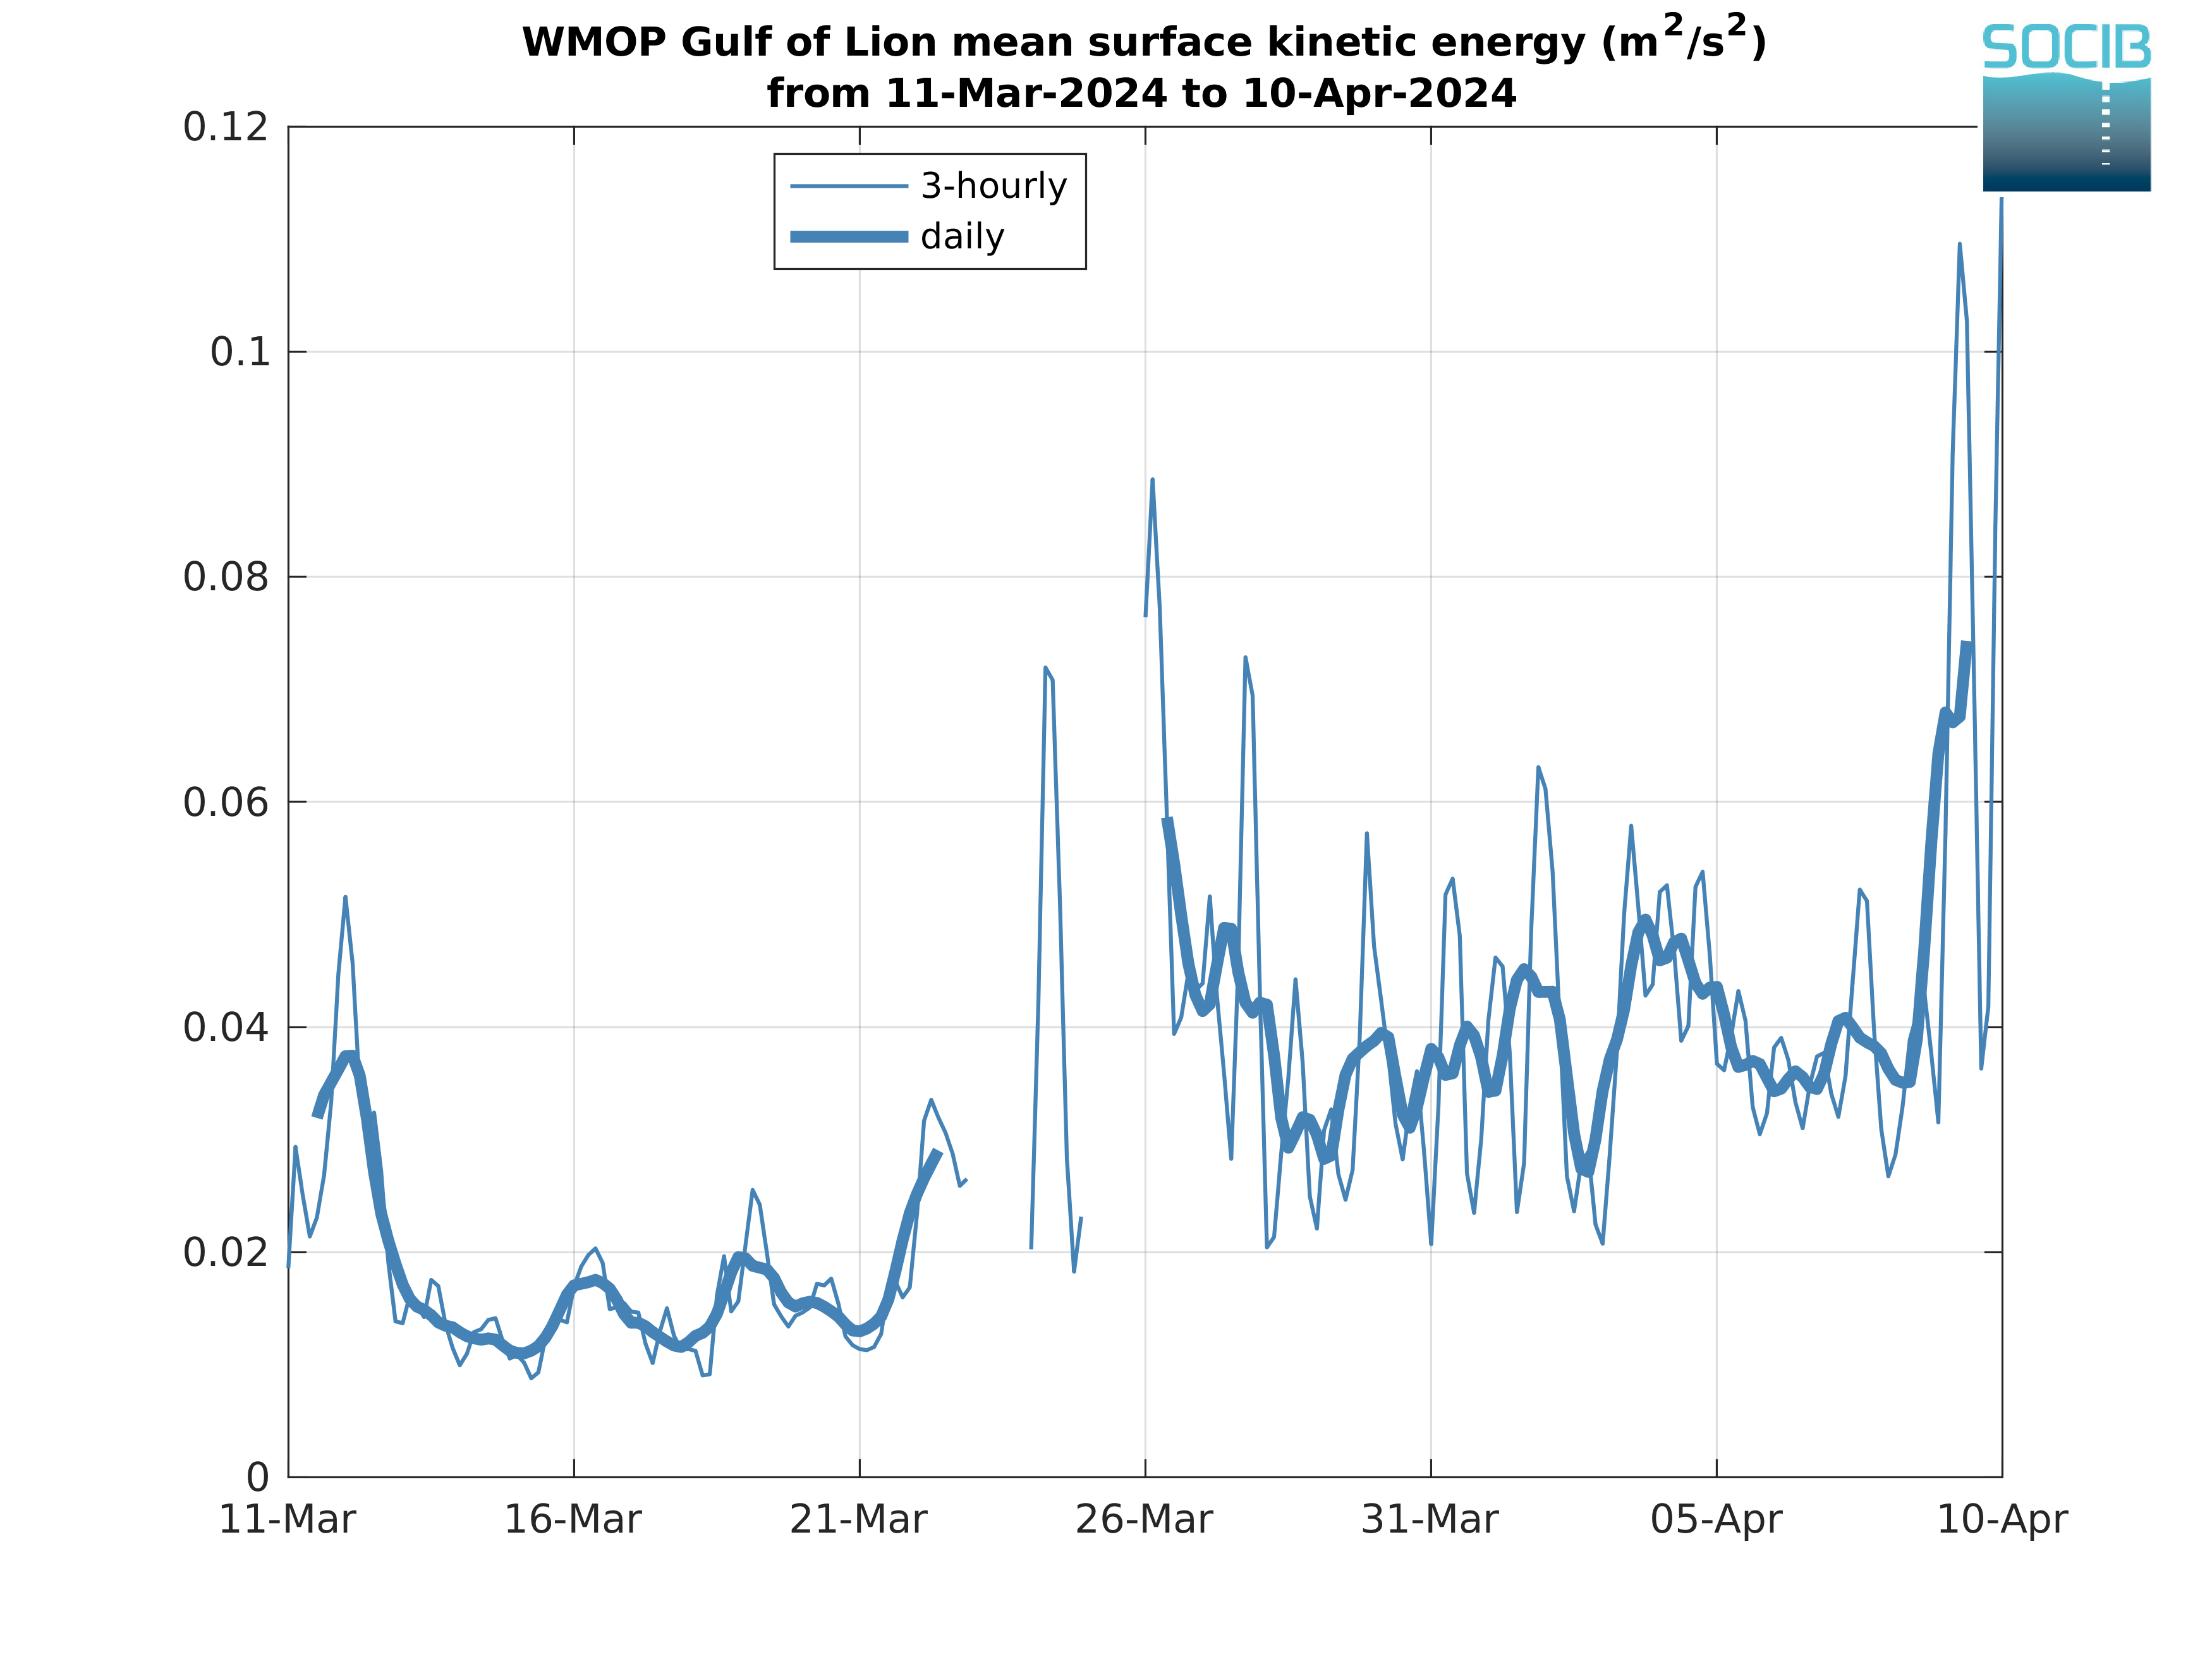
Surface Kinetic Energy

|

|
| Figure 1: WMOP daily mean surface KE | Figure 2: WMOP spatially averaged surface KE over the last 30 days |
|
|
|
| Figure 3: WMOP spatially averaged surface KE over the last 30 days in the Alboran Sea | Figure 4: WMOP spatially averaged surface KE over the last 30 days in the Balearic Sea | Figure 5: WMOP spatially averaged surface KE over the last 30 days in the Gulf of Lion |
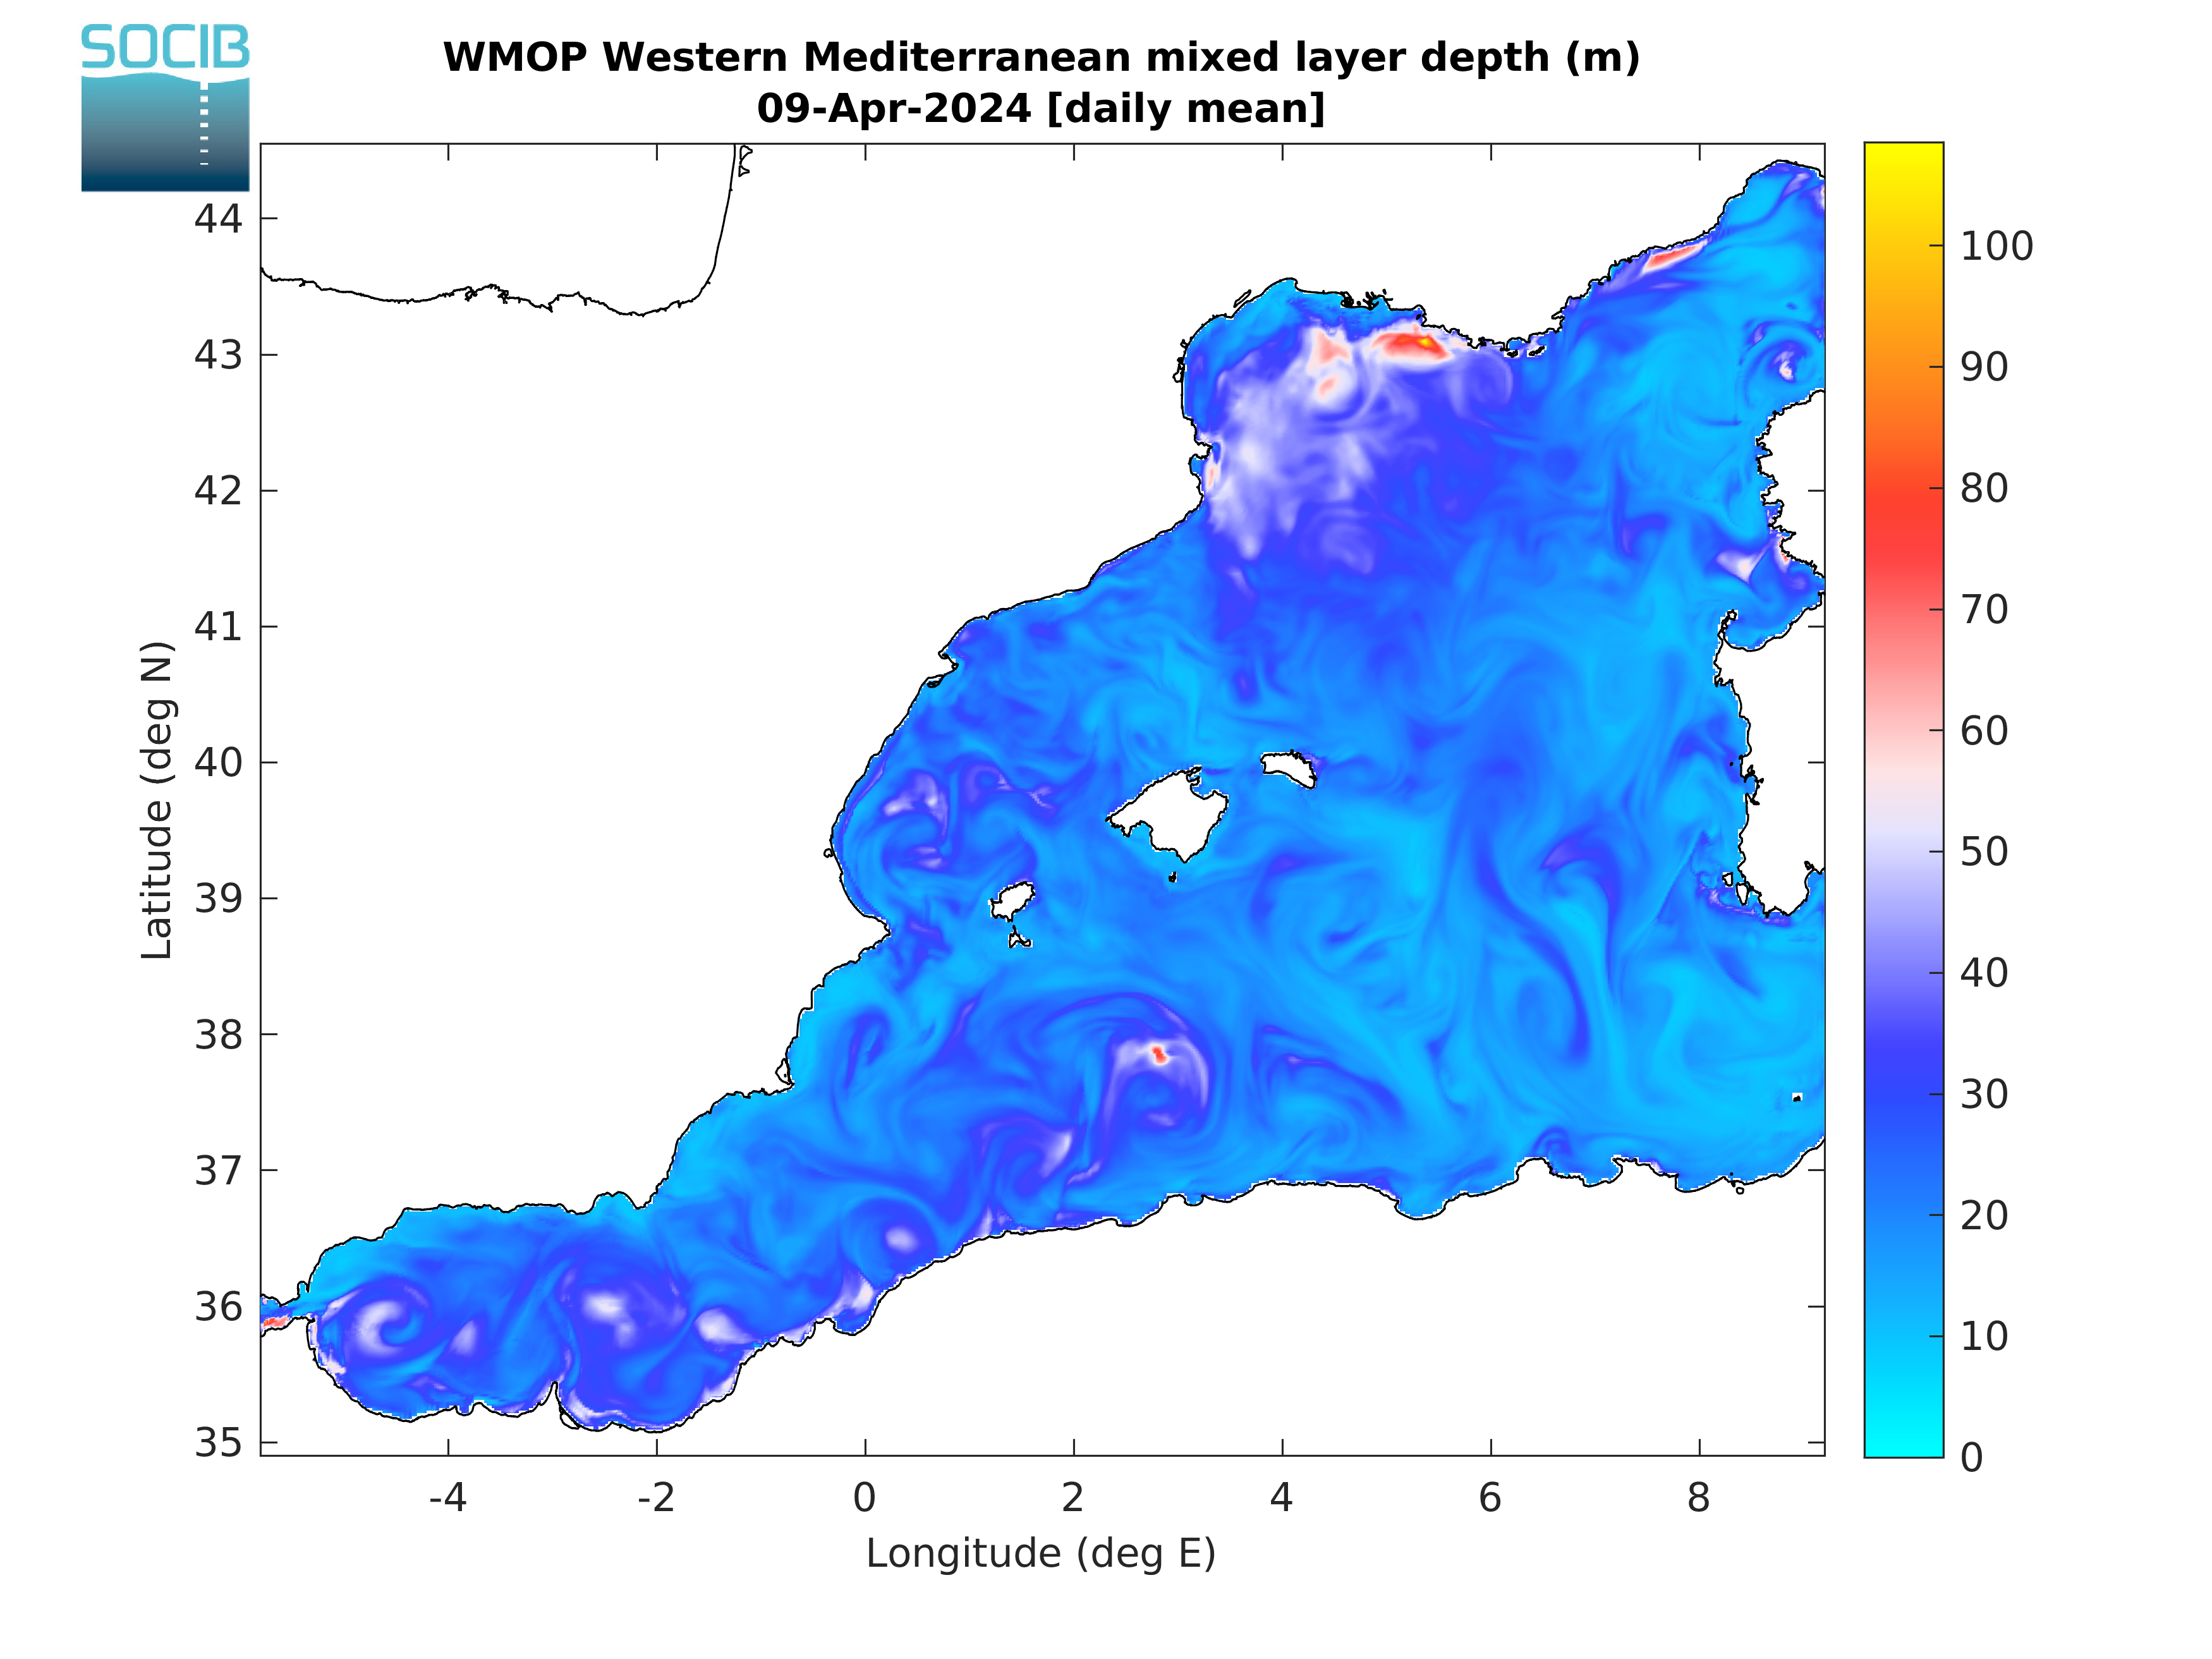
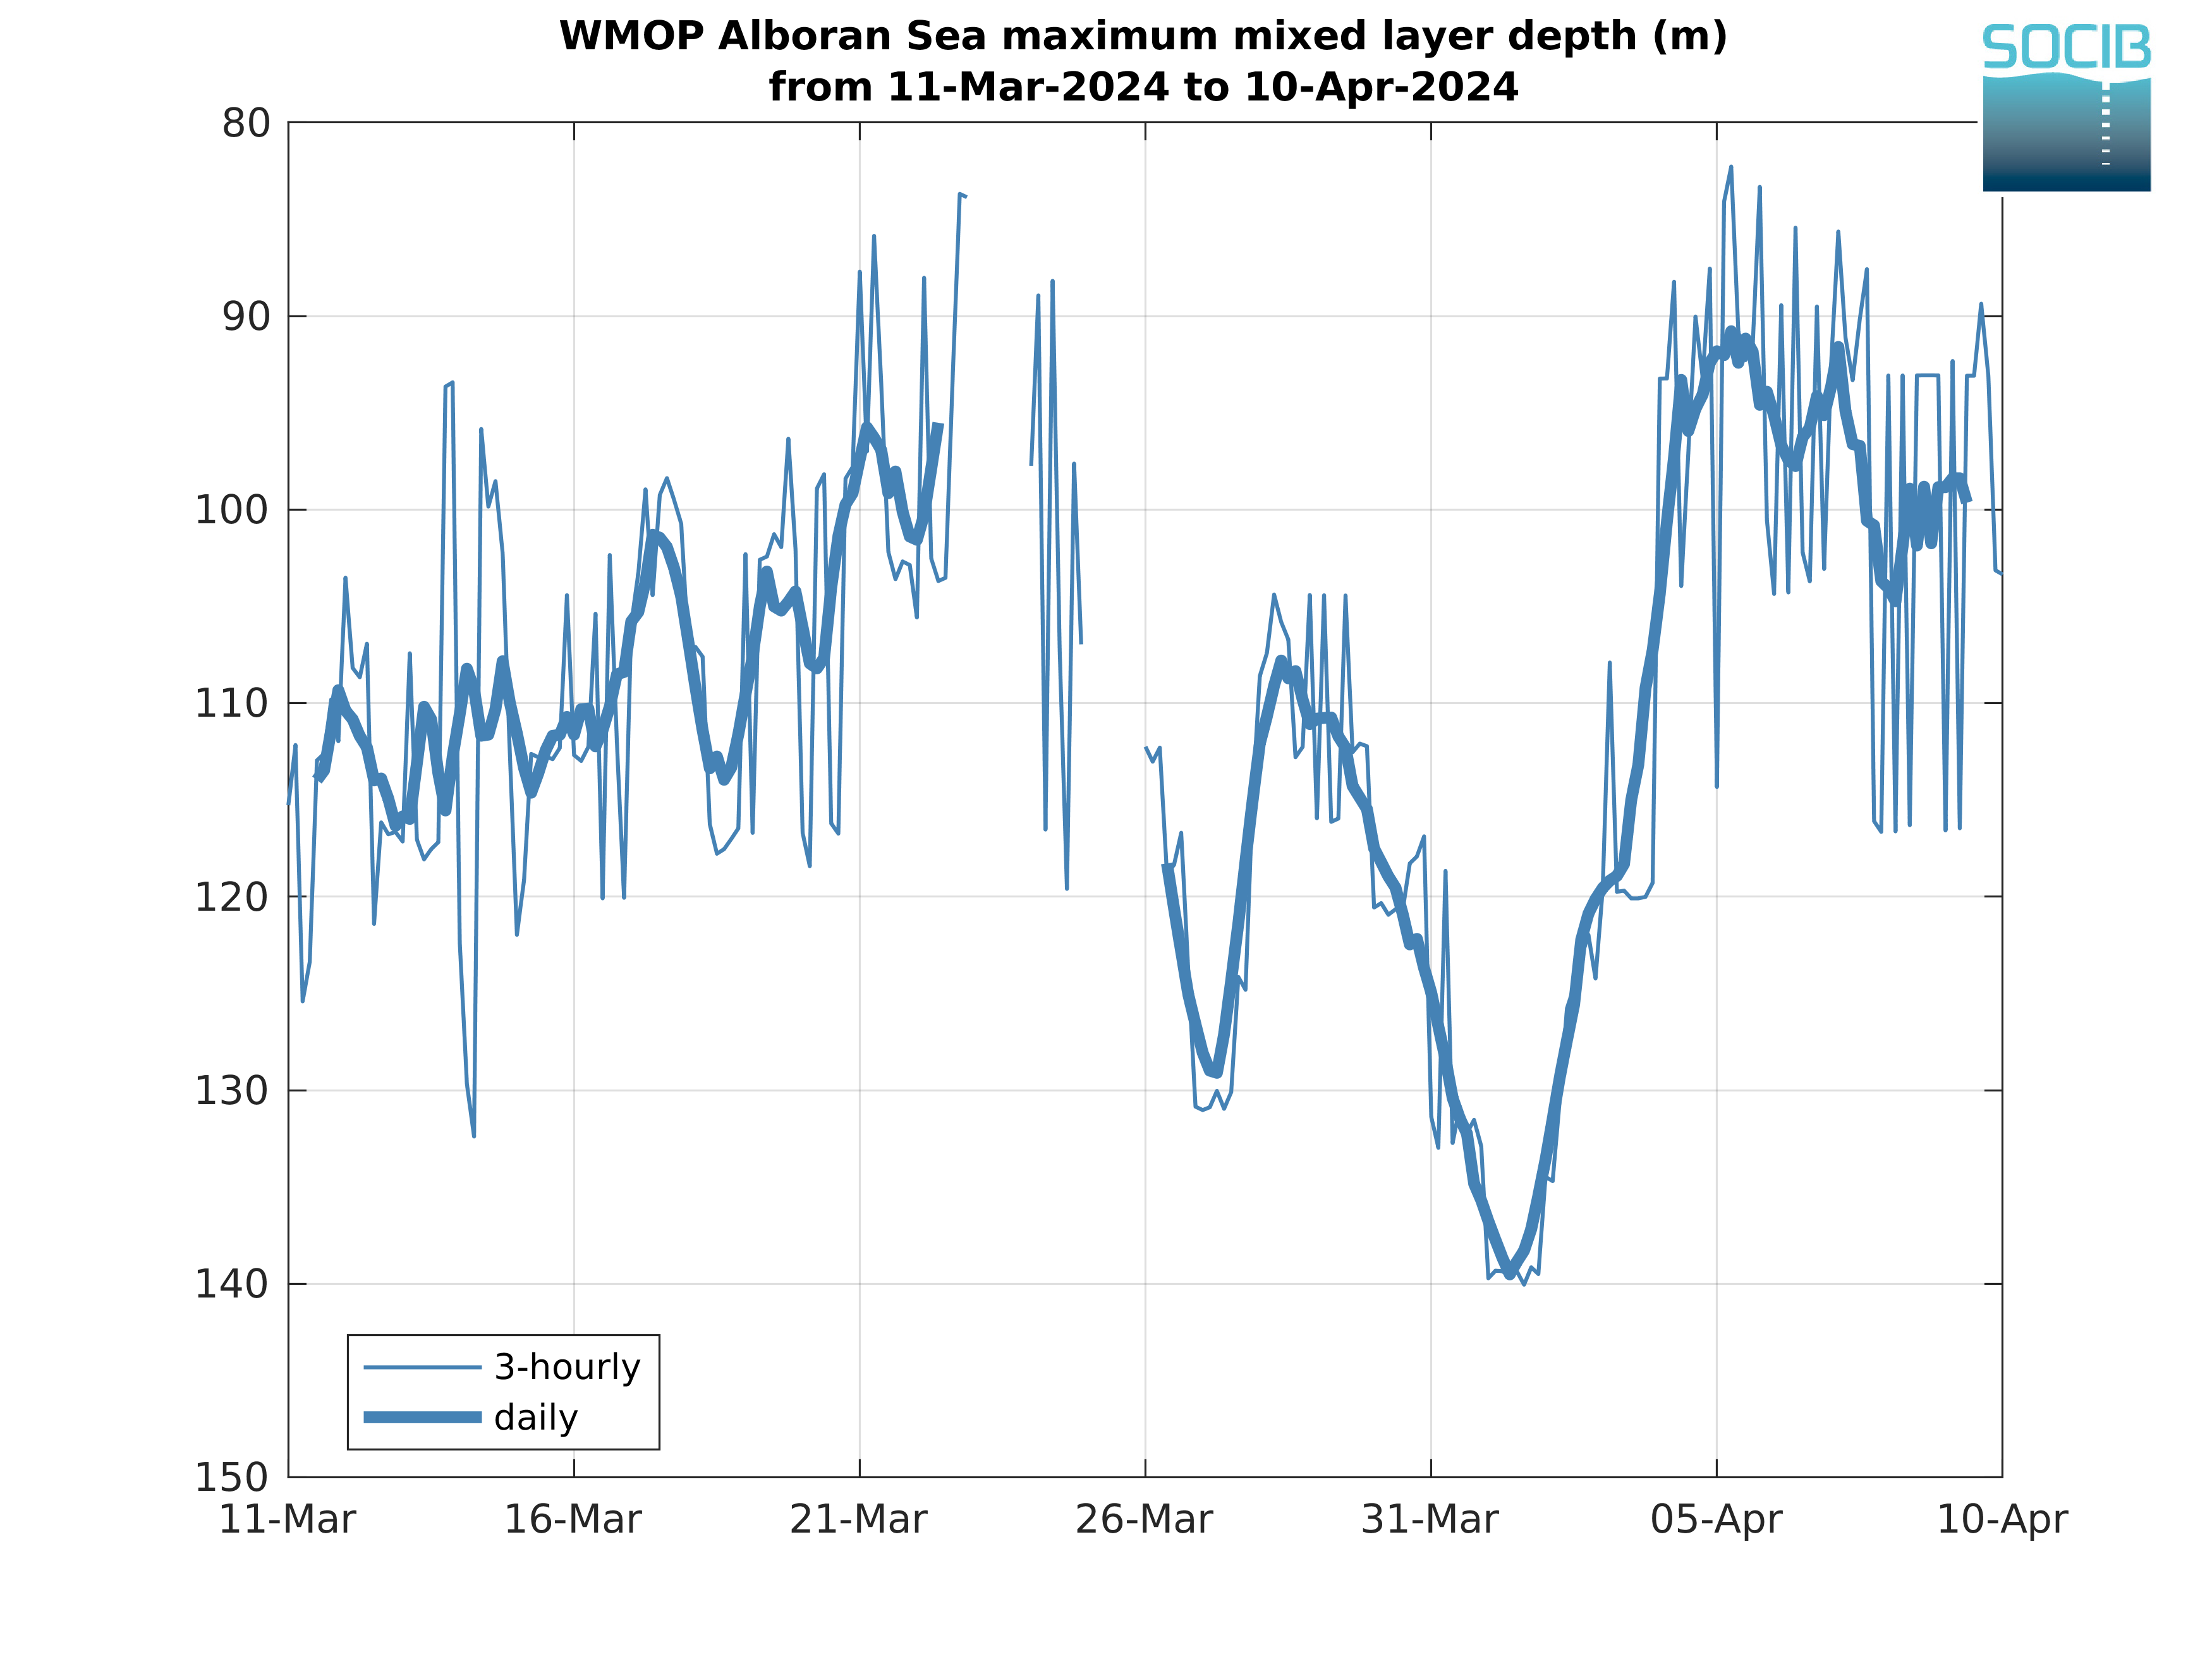
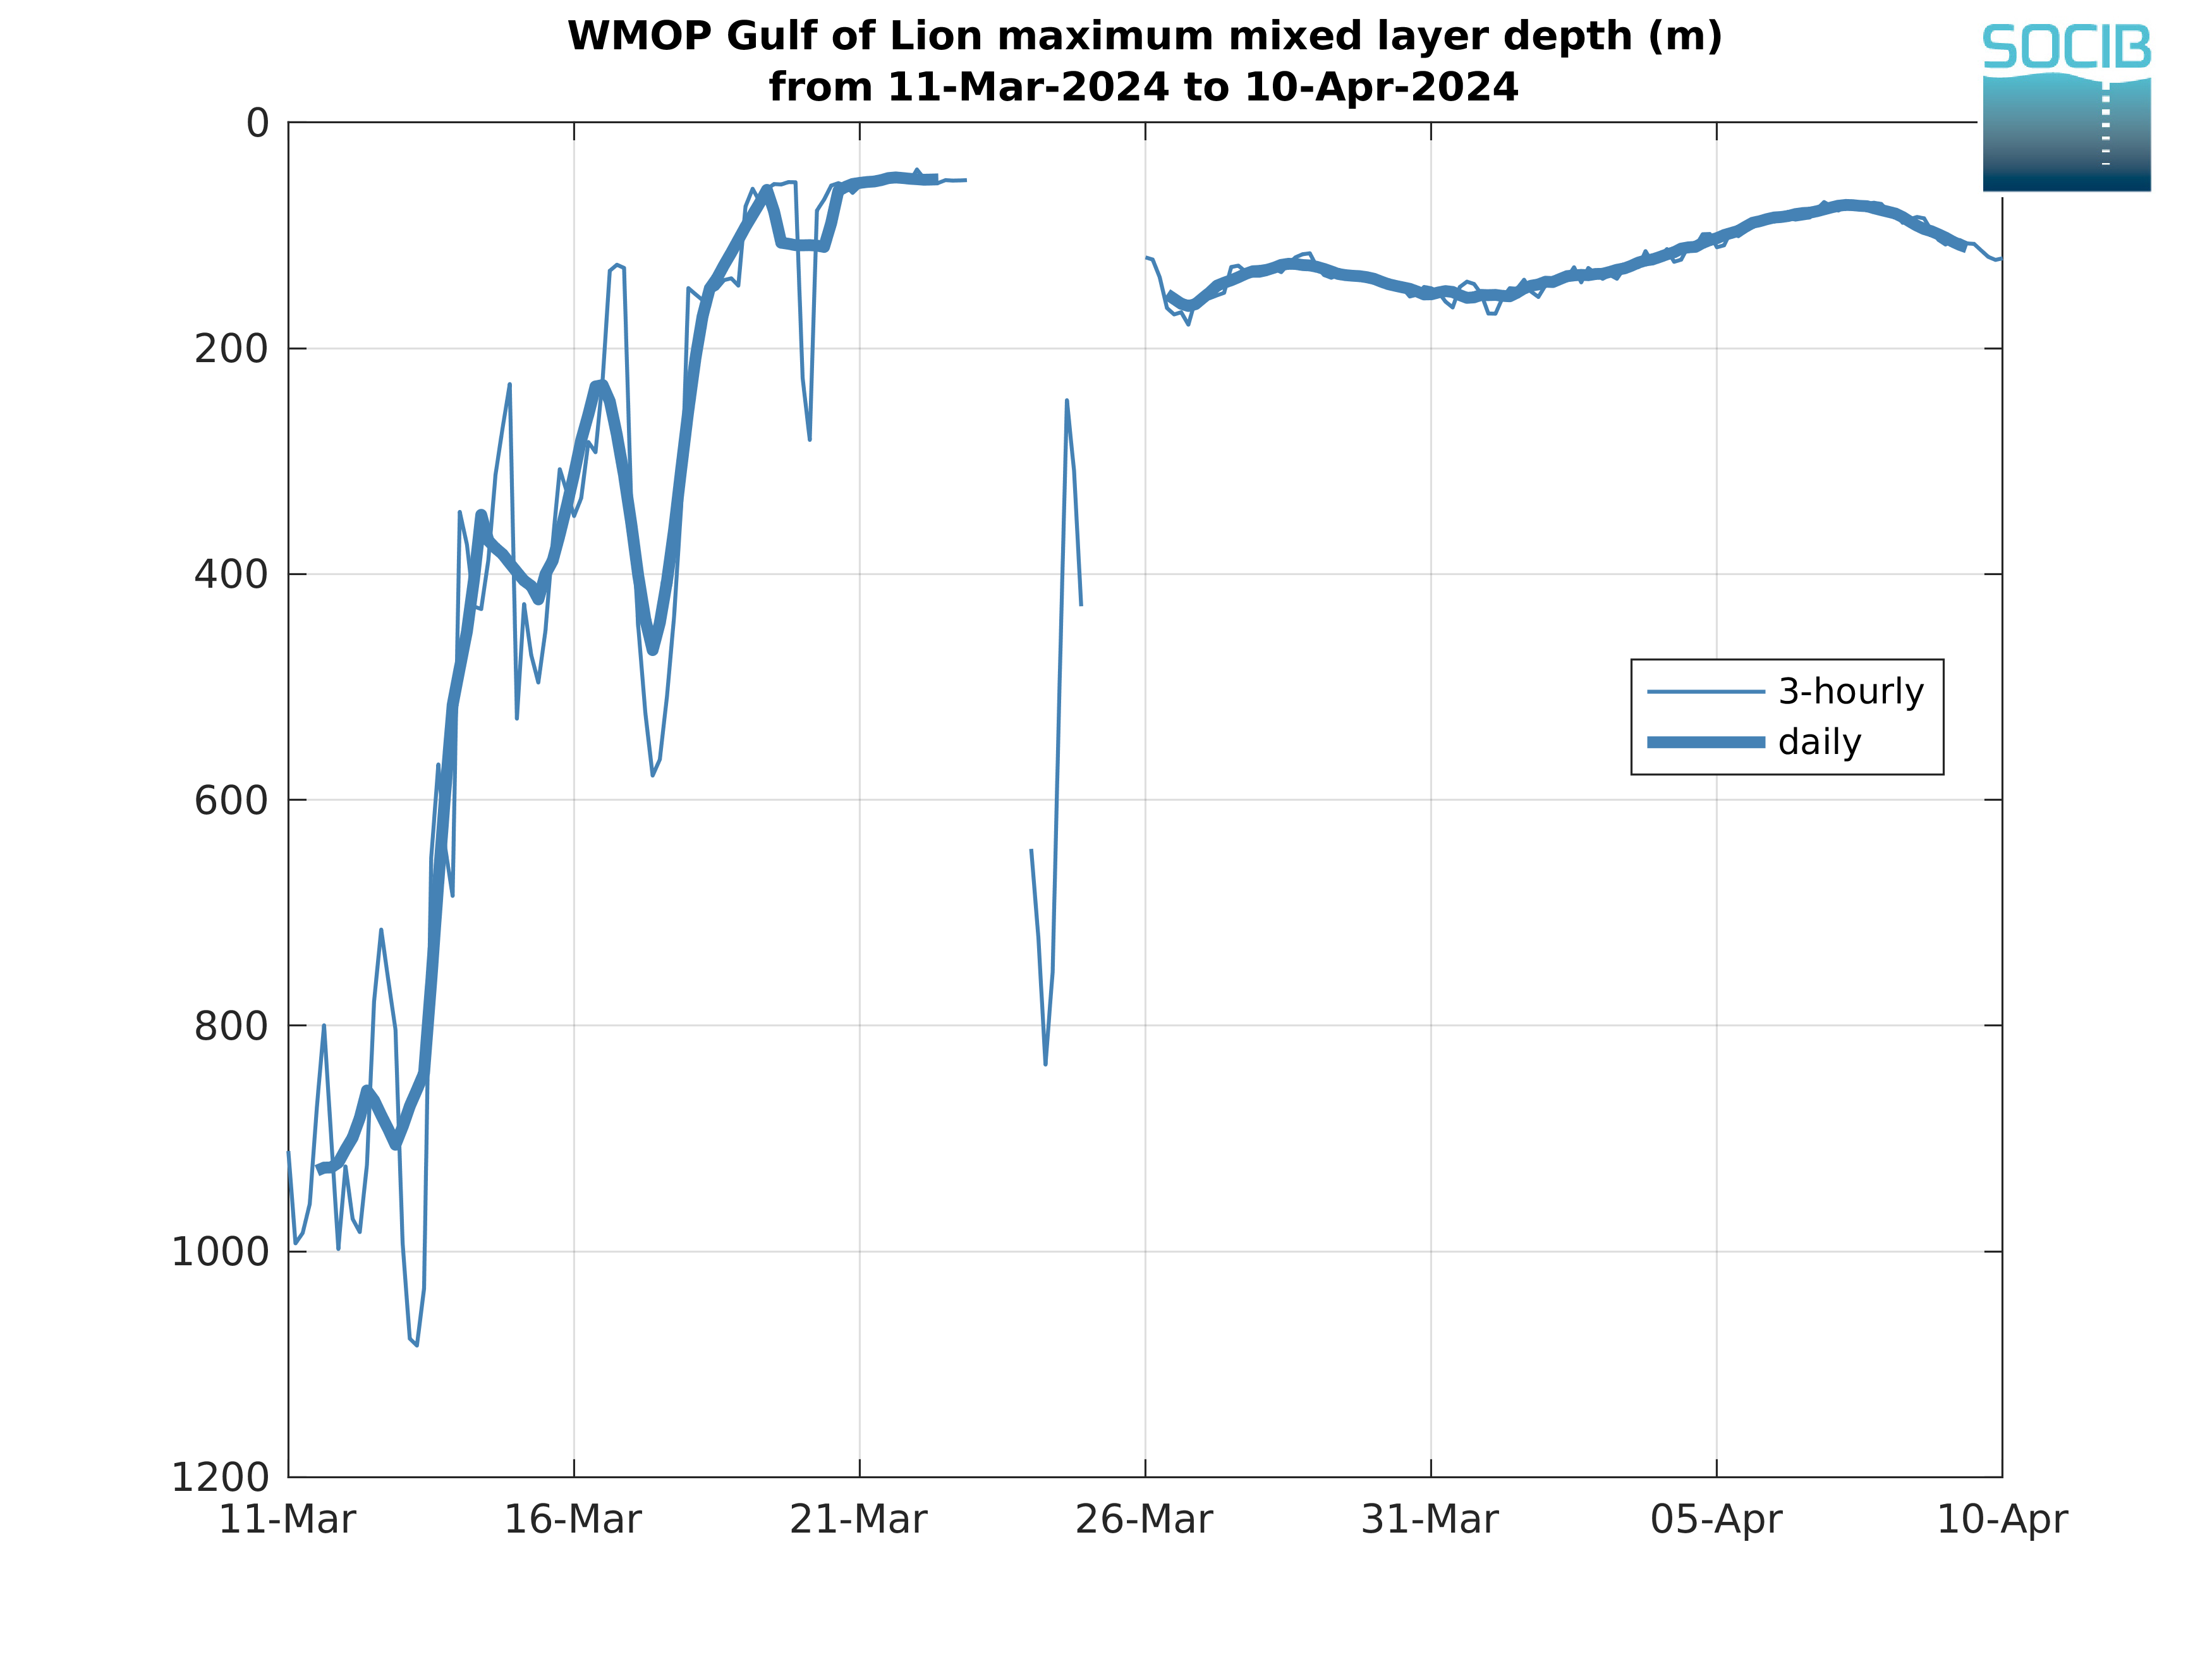
Mixed Layer Depth
The highly variable ocean surface mixed layer is the layer where ocean-atmosphere exchanges of mass, momentum, energy, freshwater and heat take place, and where major biological and chemical processes occur.
The temporal evolution of the maximum Mixed Layer Depth (MLD) is monitored in this section, both for the whole modelling domain and in the three sub-regions defined in Figure 1.
The mixed layer depths are calculated using a density criterion with a threshold value ∆σθ corresponding to a fixed ∆T=0.2°C.
|

|
| Figure 1: WMOP daily mean MLD | Figure 2: WMOP maximum MLD over the last 30 days |
|

|
|
| Figure 3: WMOP maximum MLD over the last 30 days in the Alboran Sea | Figure 4: WMOP maximum MLD over the last 30 days in the Balearic Sea | Figure 5: WMOP maximum MLD over the last 30 days in the Gulf of Lion |
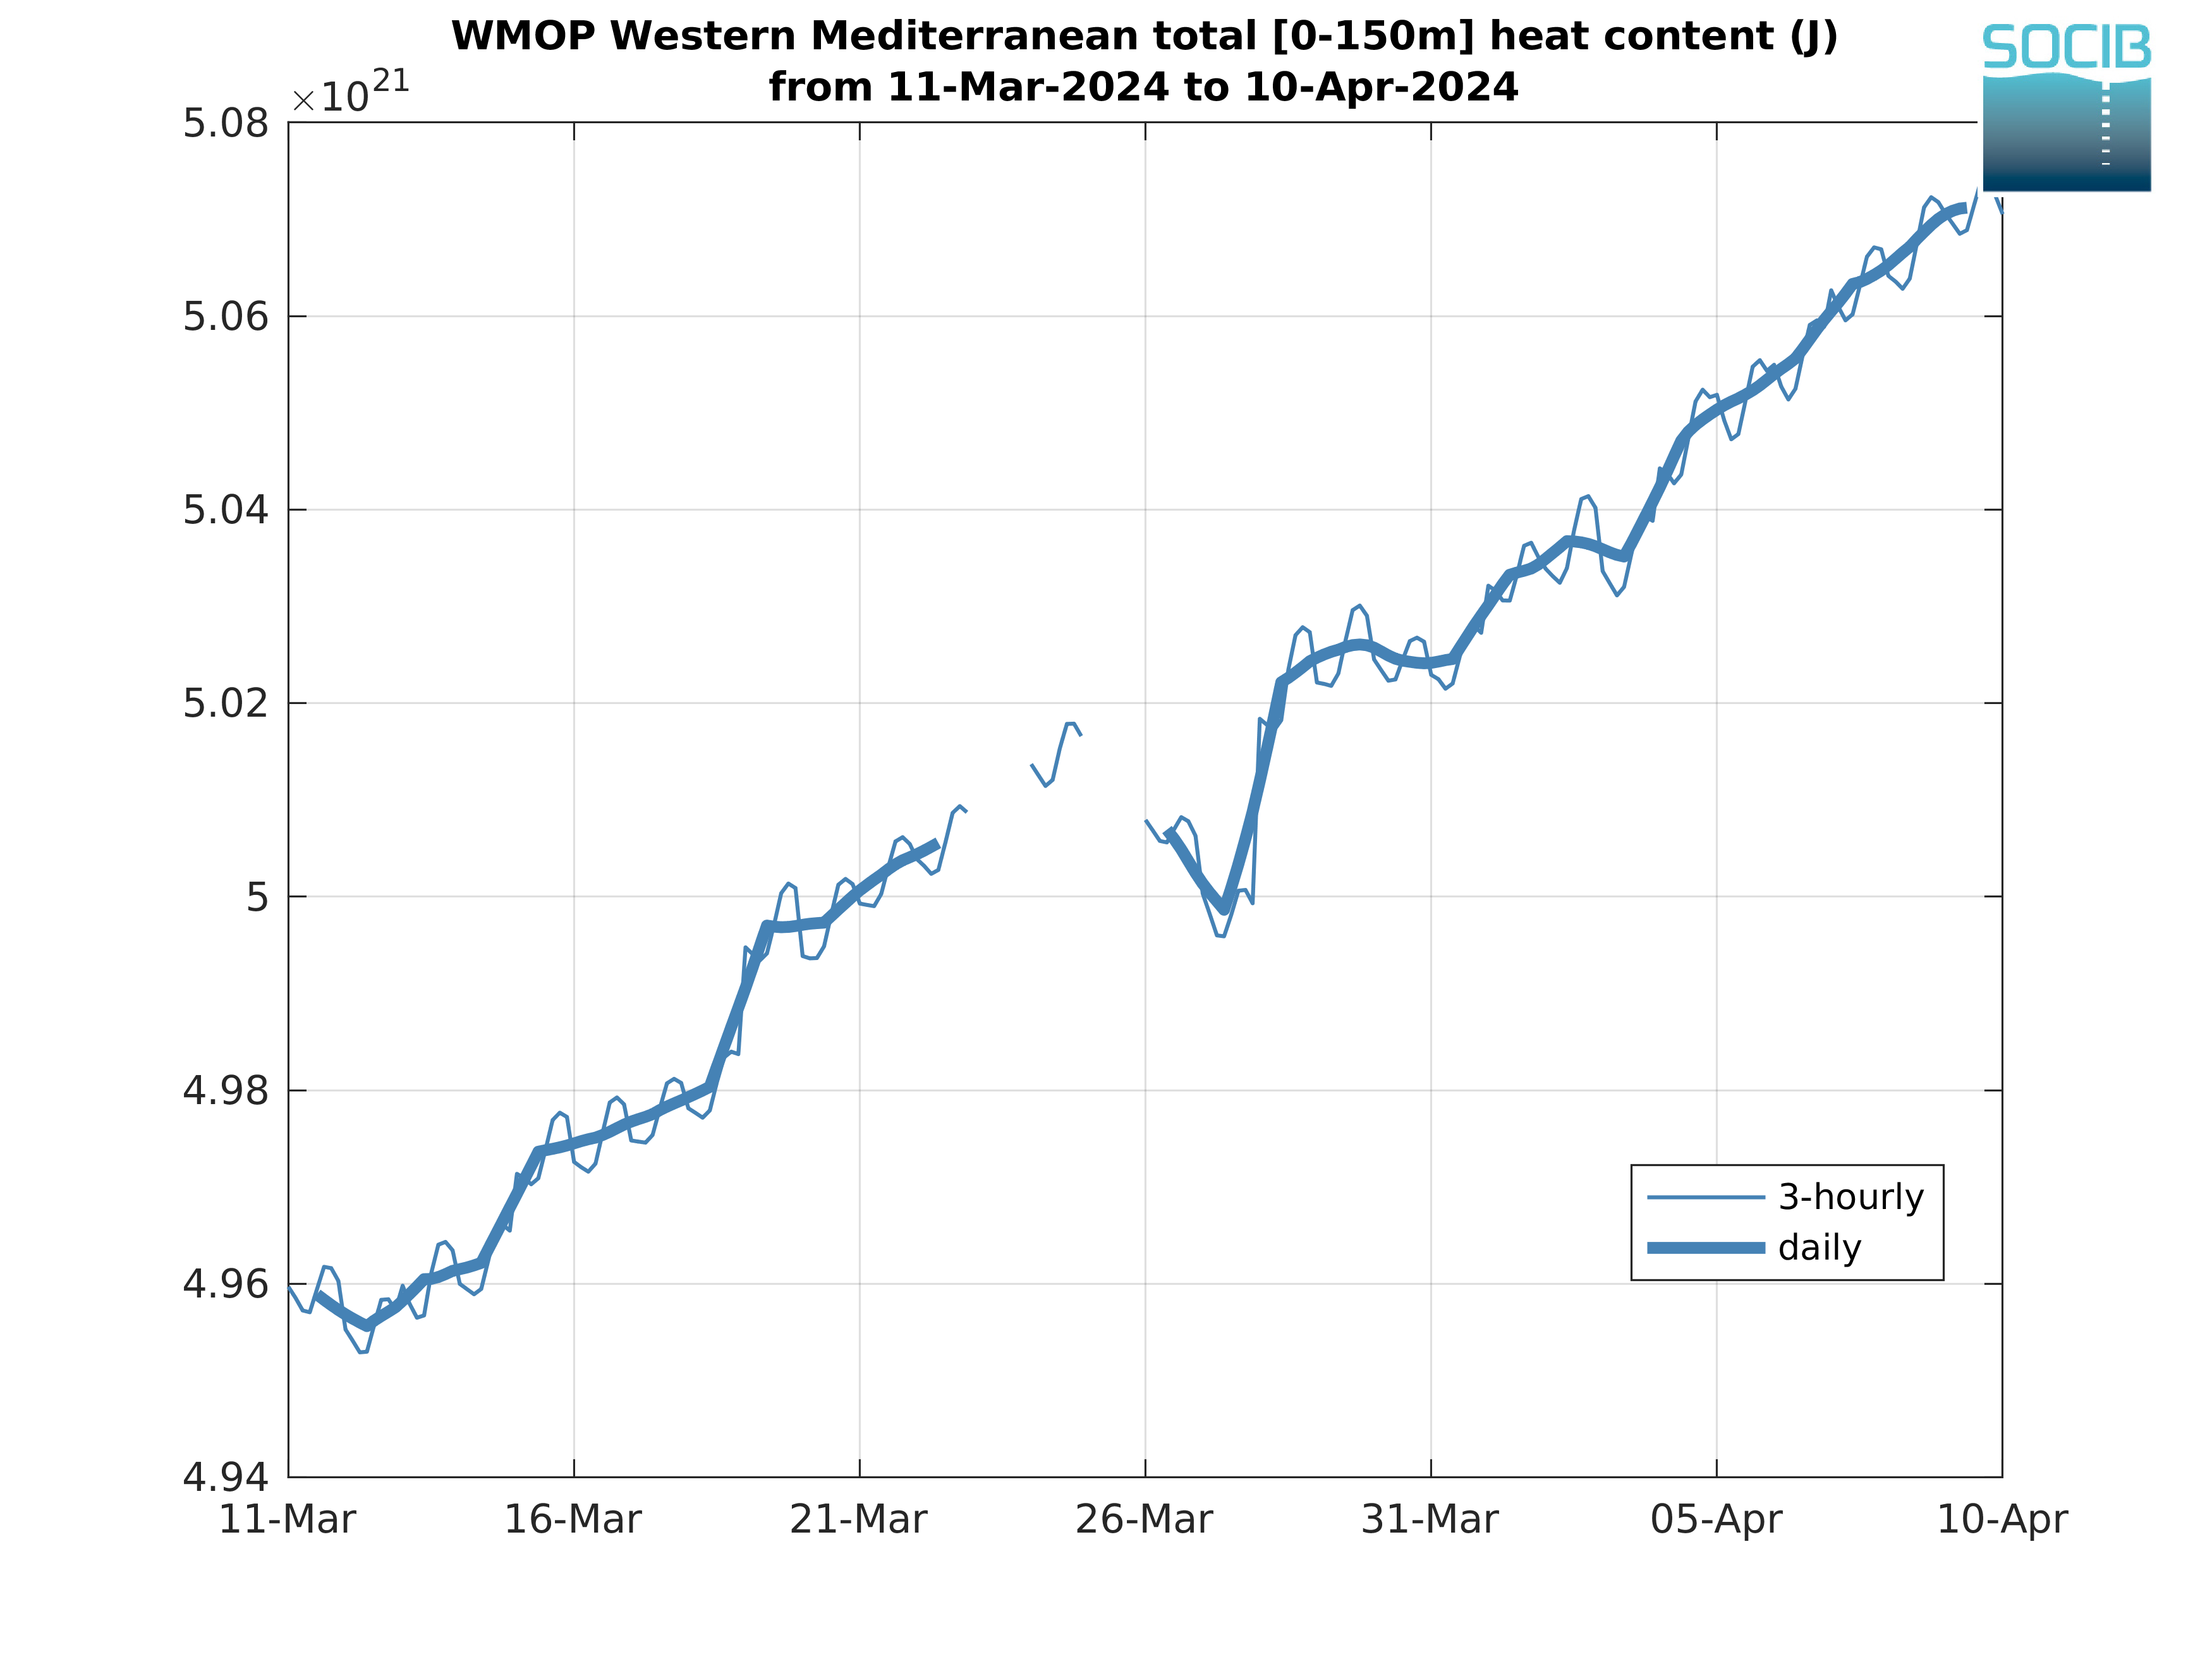
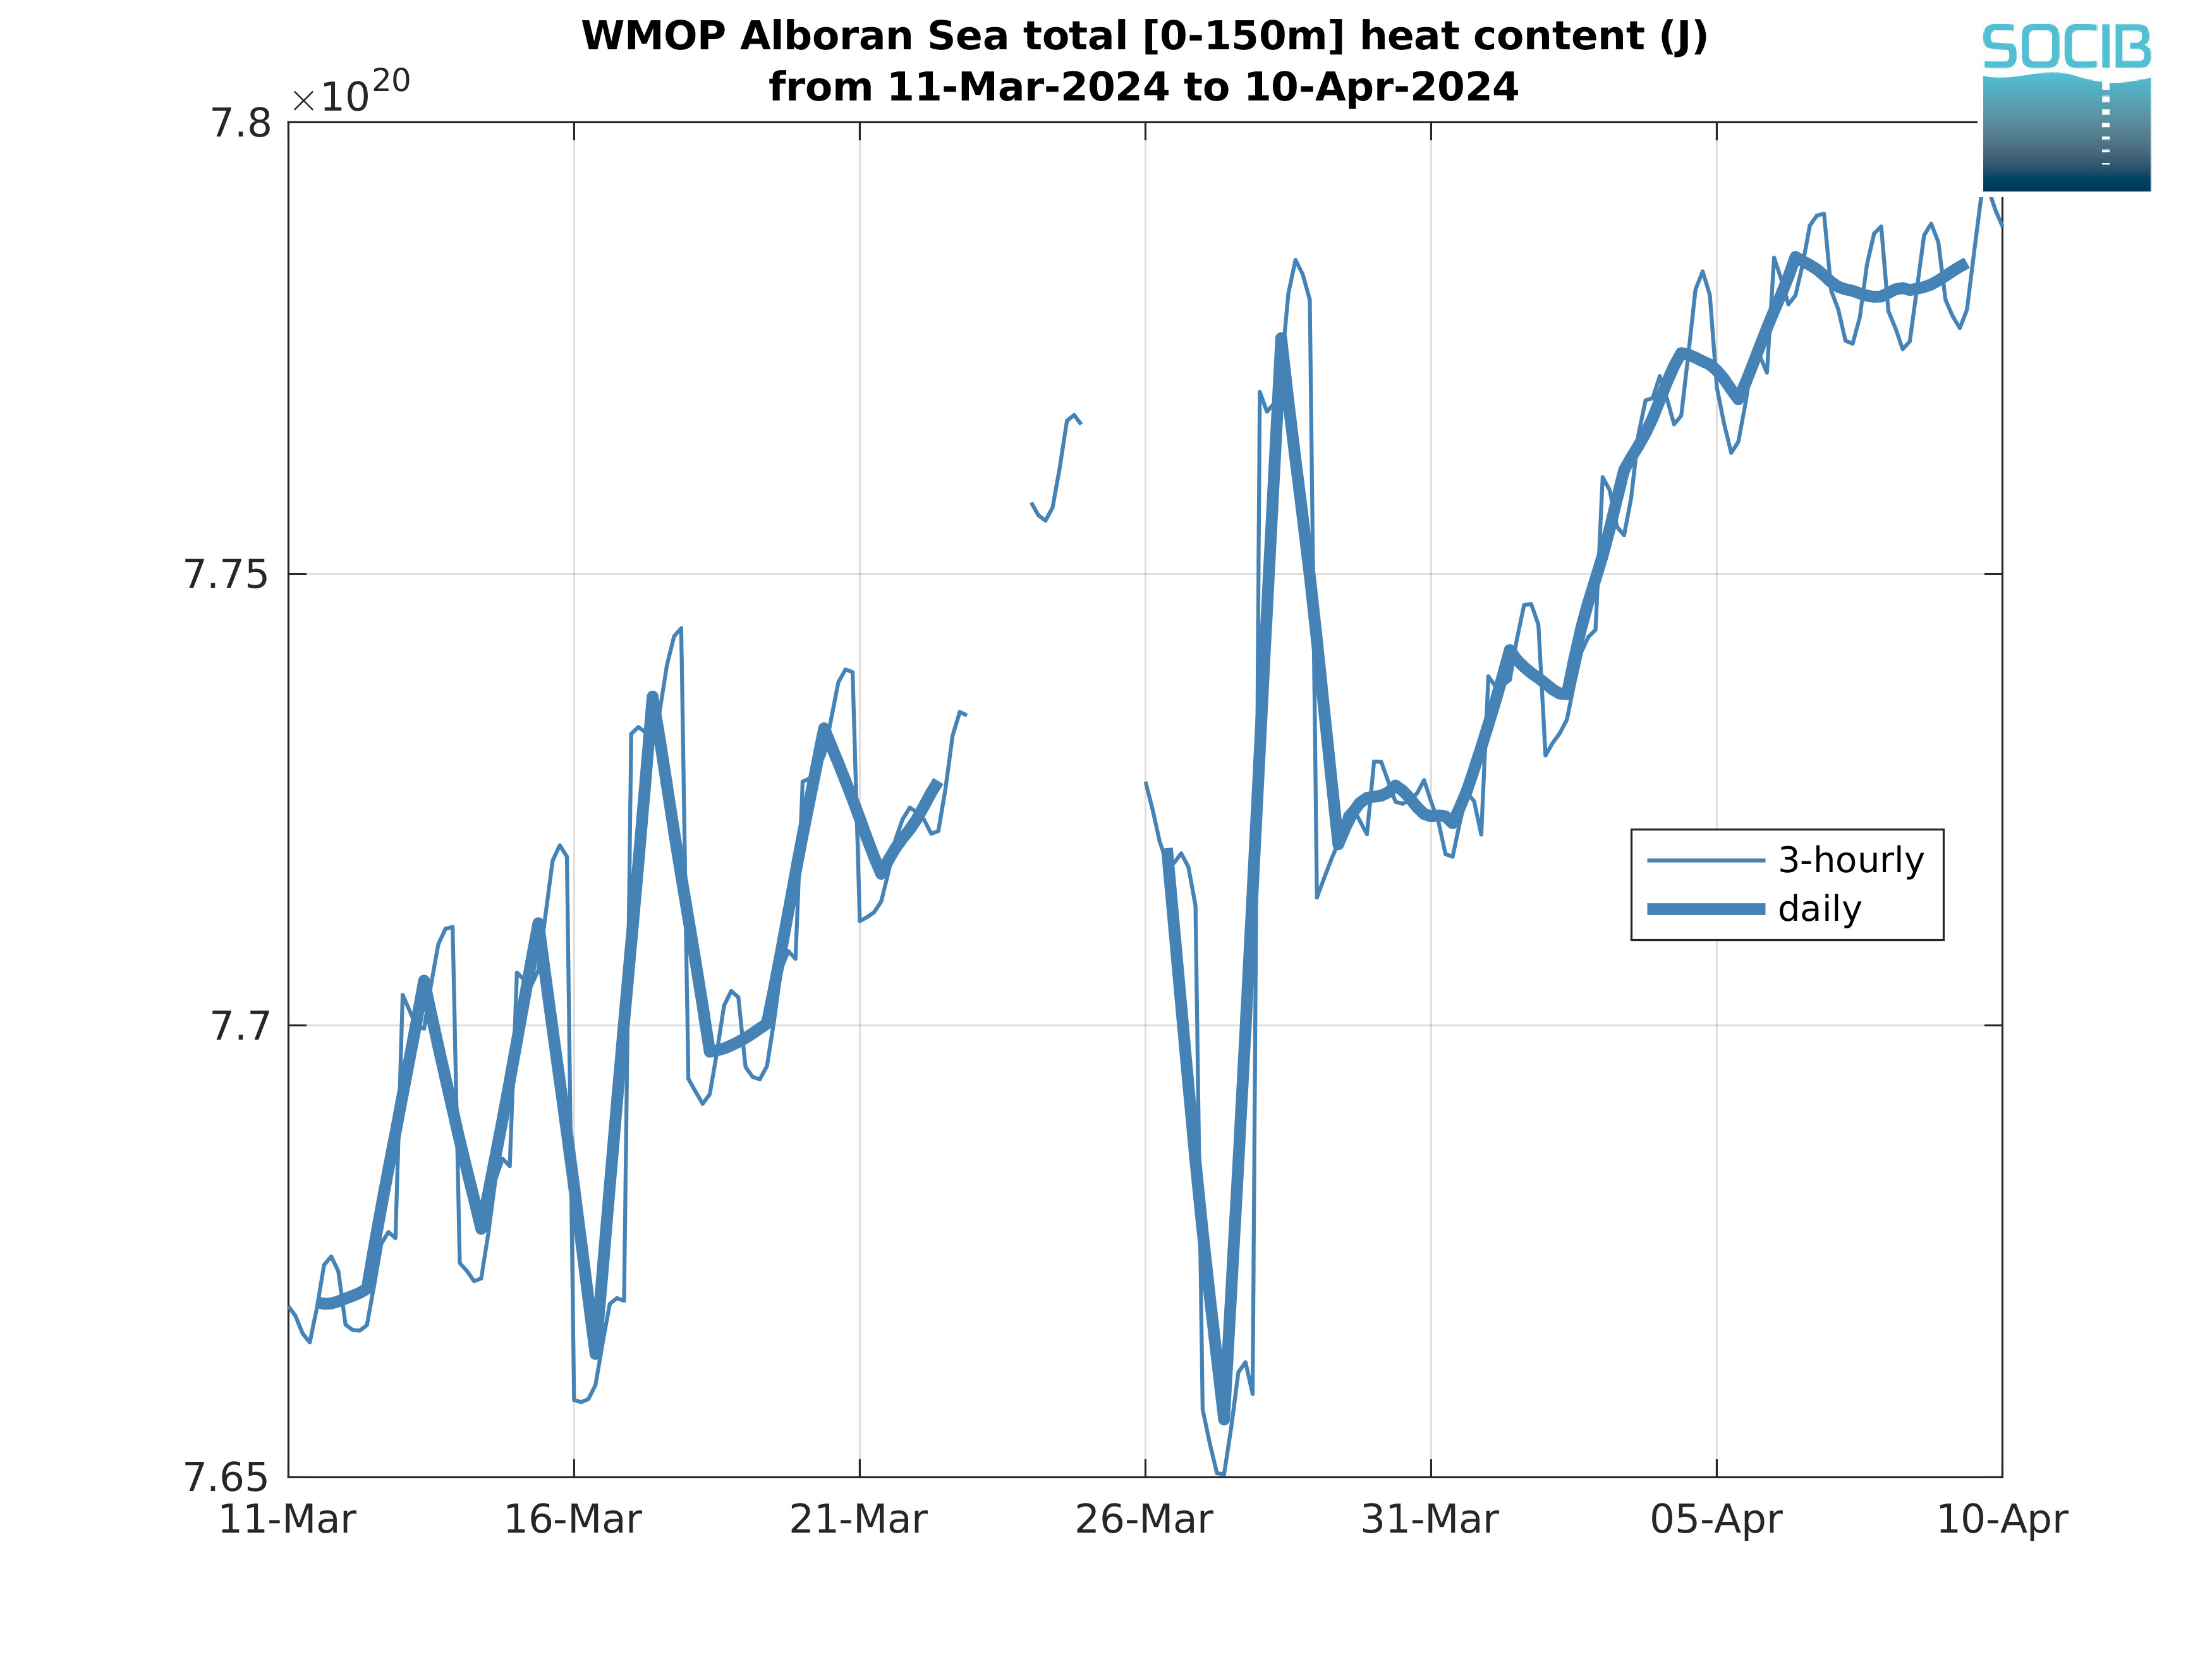
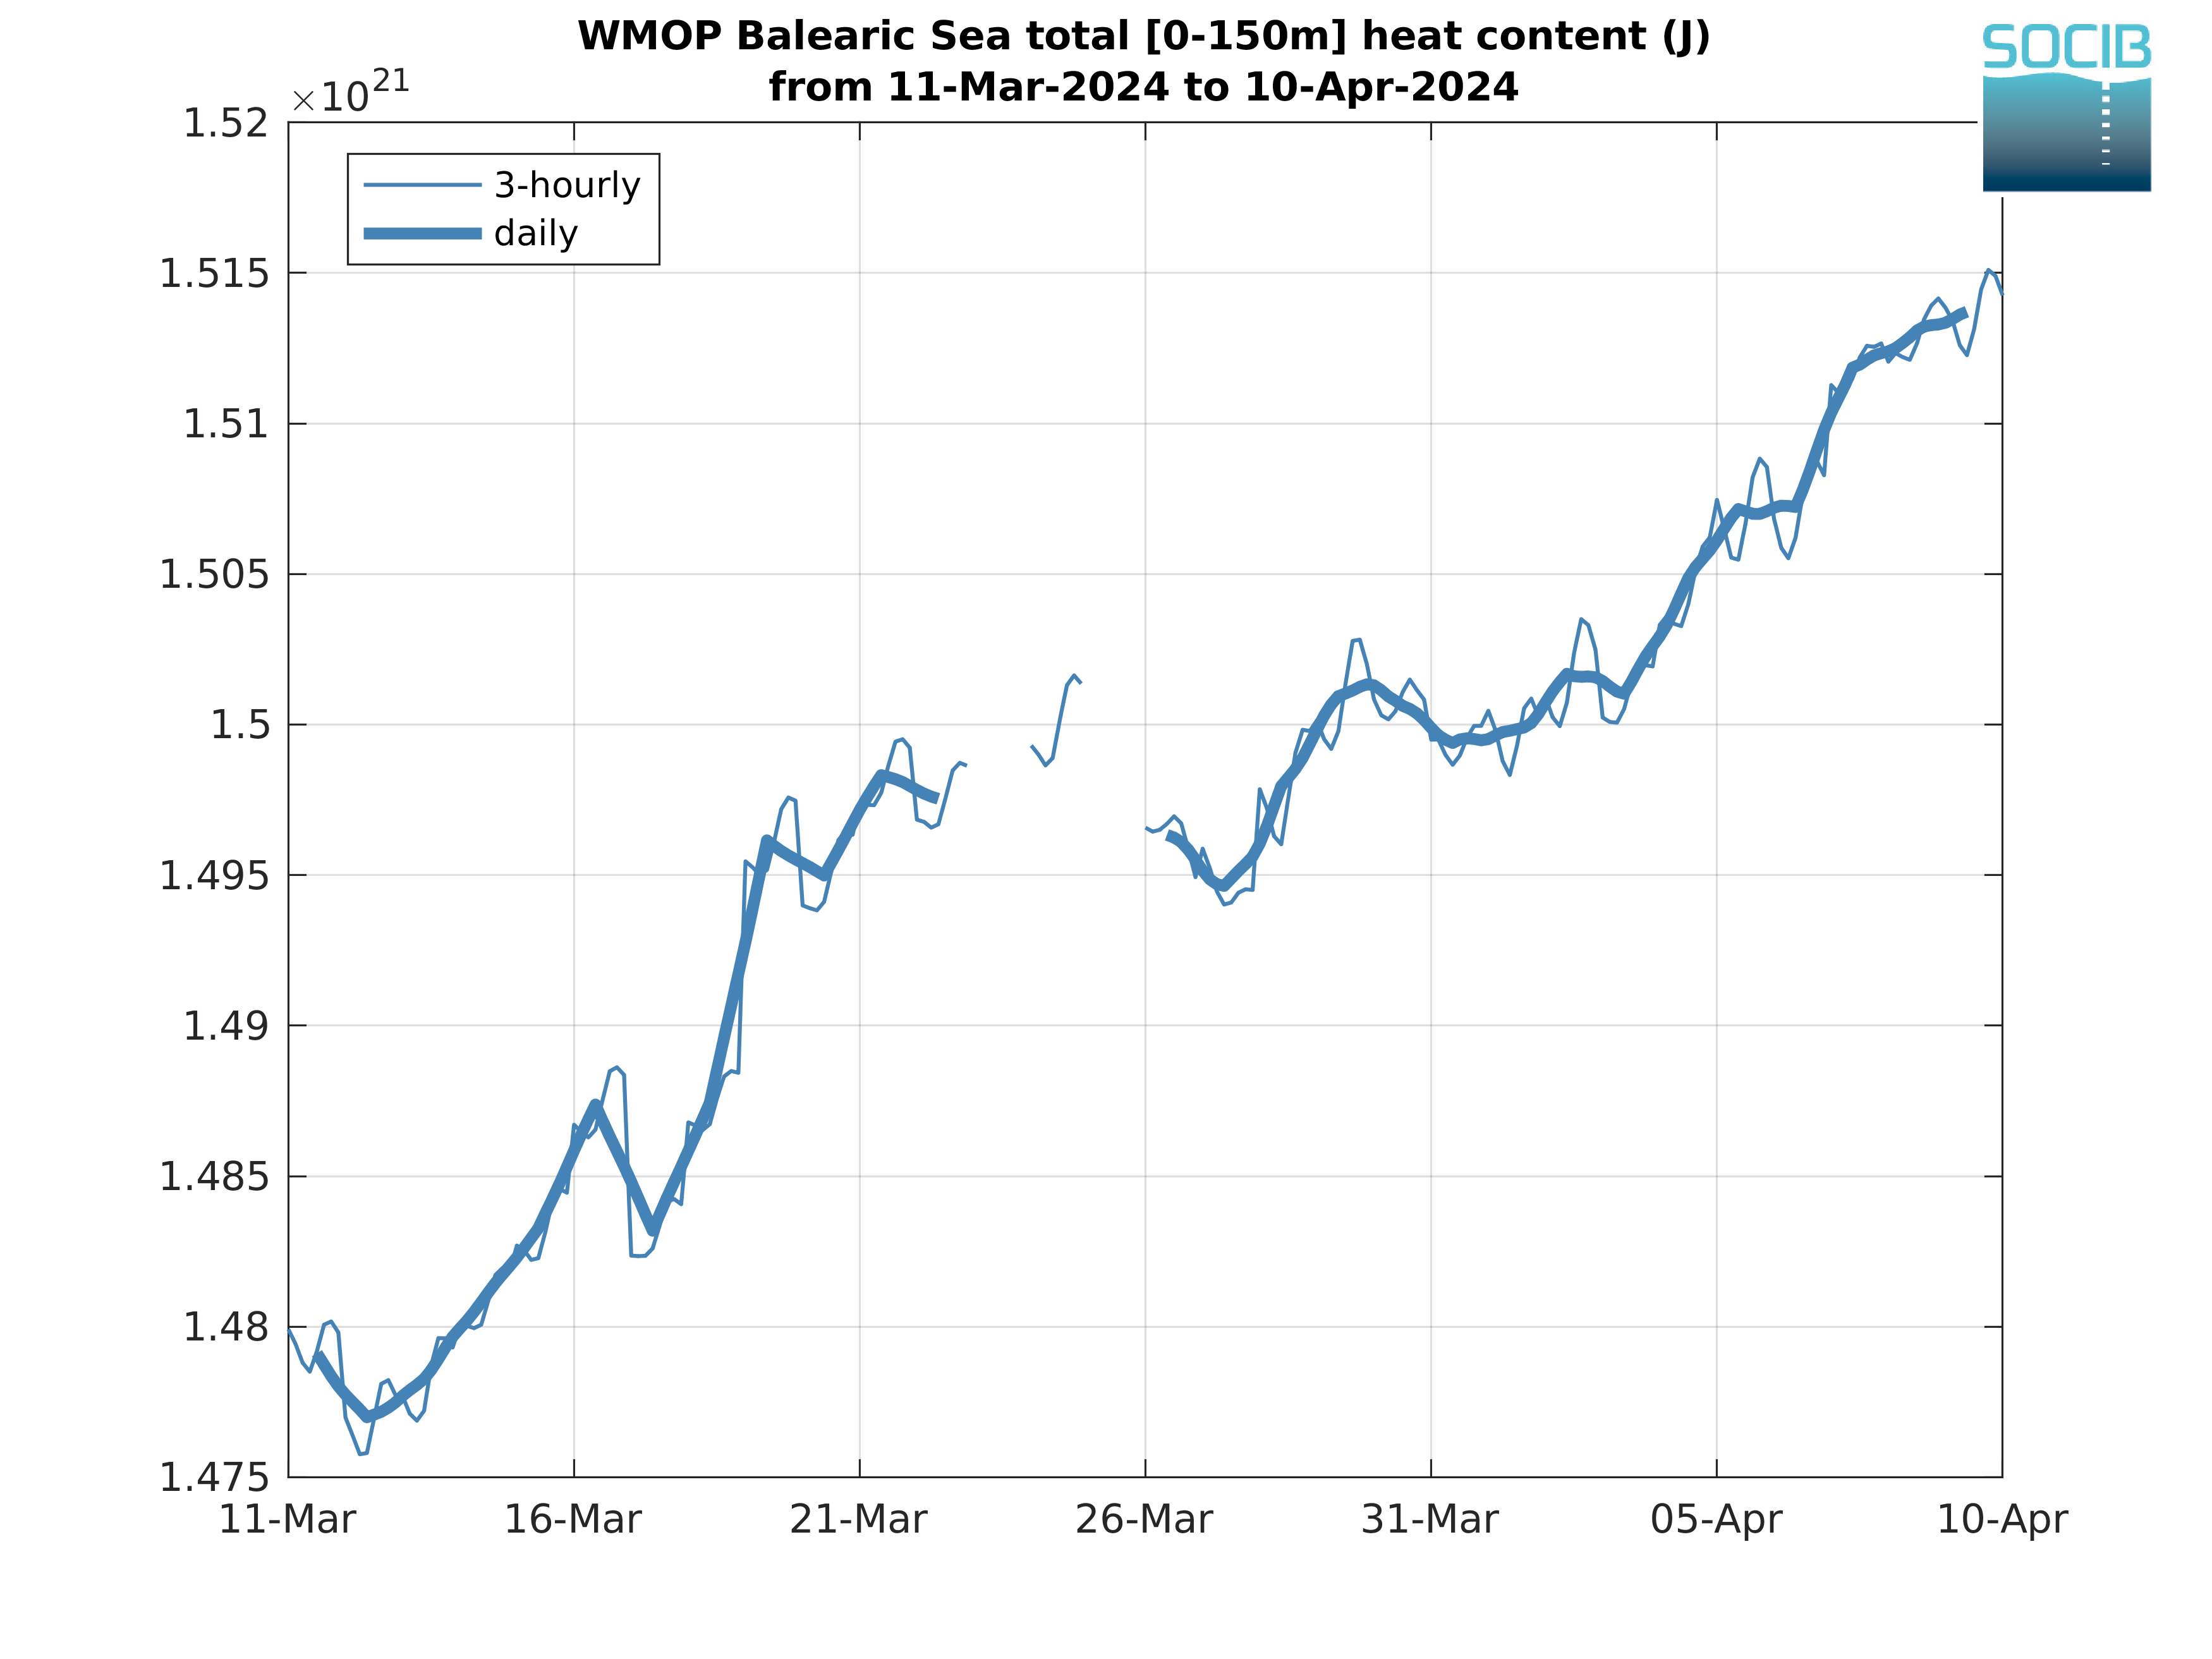
Heat Content [0-150m]
The heat content integrated in the surface layer down to 150m can be considered as a climatic proxy to monitor the ocean heat content as well as the air-sea heat exchanges. The temporal evolution of the [0-150m] Heat Content (HC[0-150m]) is displayed in this section, both for the whole modelling domain and in the three sub-regions defined in Figure 1.
|
| Figure 1: WMOP HC[0-150m] over the last 30 days |
|
|

|
| Figure 2: WMOP HC[0-150m] over the last 30 days in the Alboran Sea | Figure 3: WMOP HC[0-150m] over the last 30 days in the Balearic Sea | Figure 4: WMOP HC[0-150m] over the last 30 days in the Gulf of Lion |
